 Centre for Polar Studies
dataset
Type of resources
Available actions
Topics
Keywords
Contact for the resource
Provided by
Years
Formats
Representation types
Update frequencies
status
Scale
-
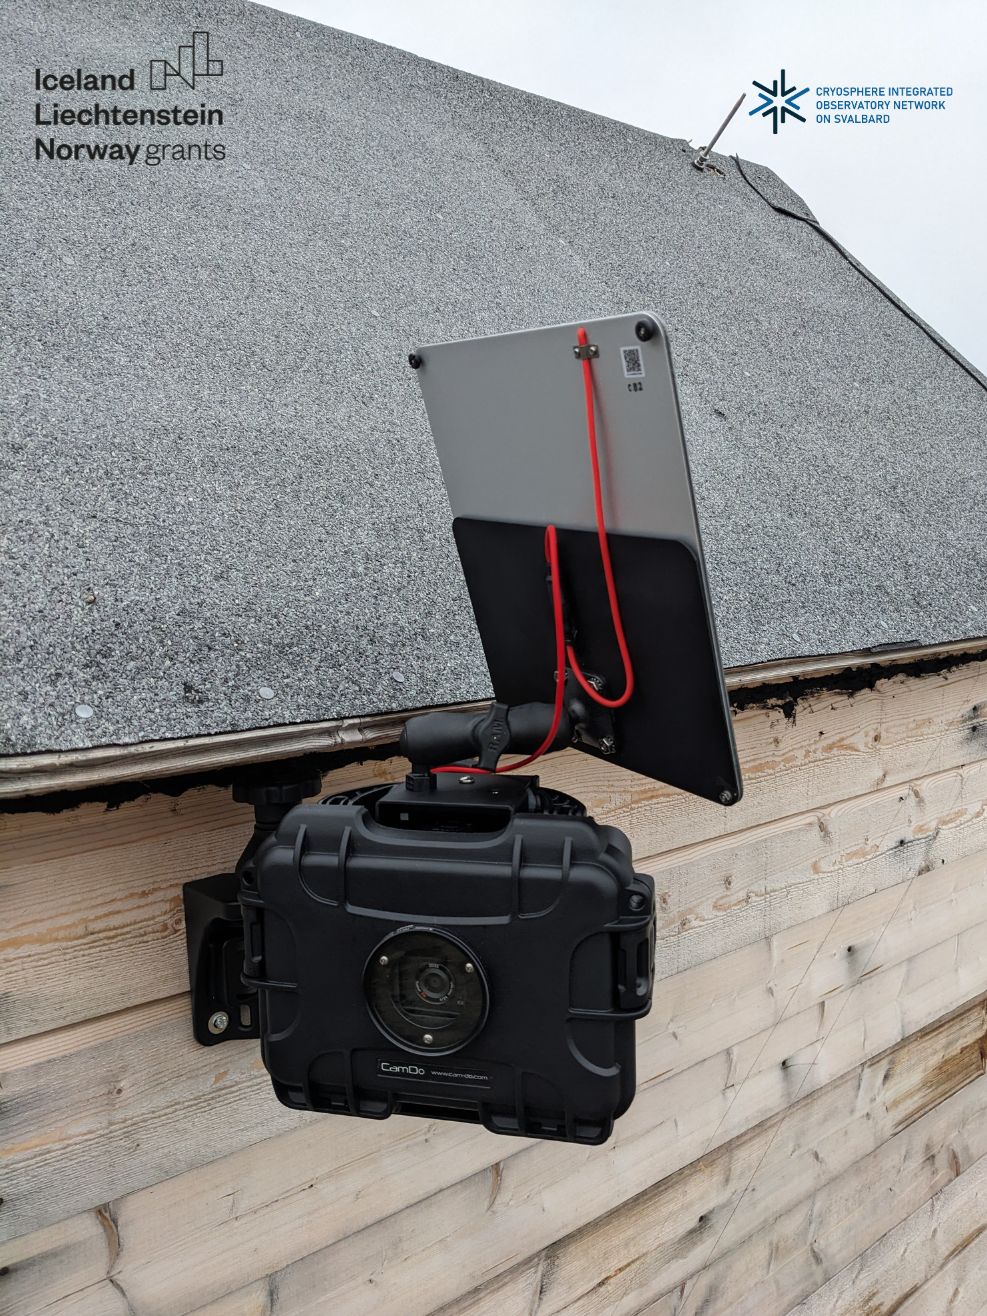
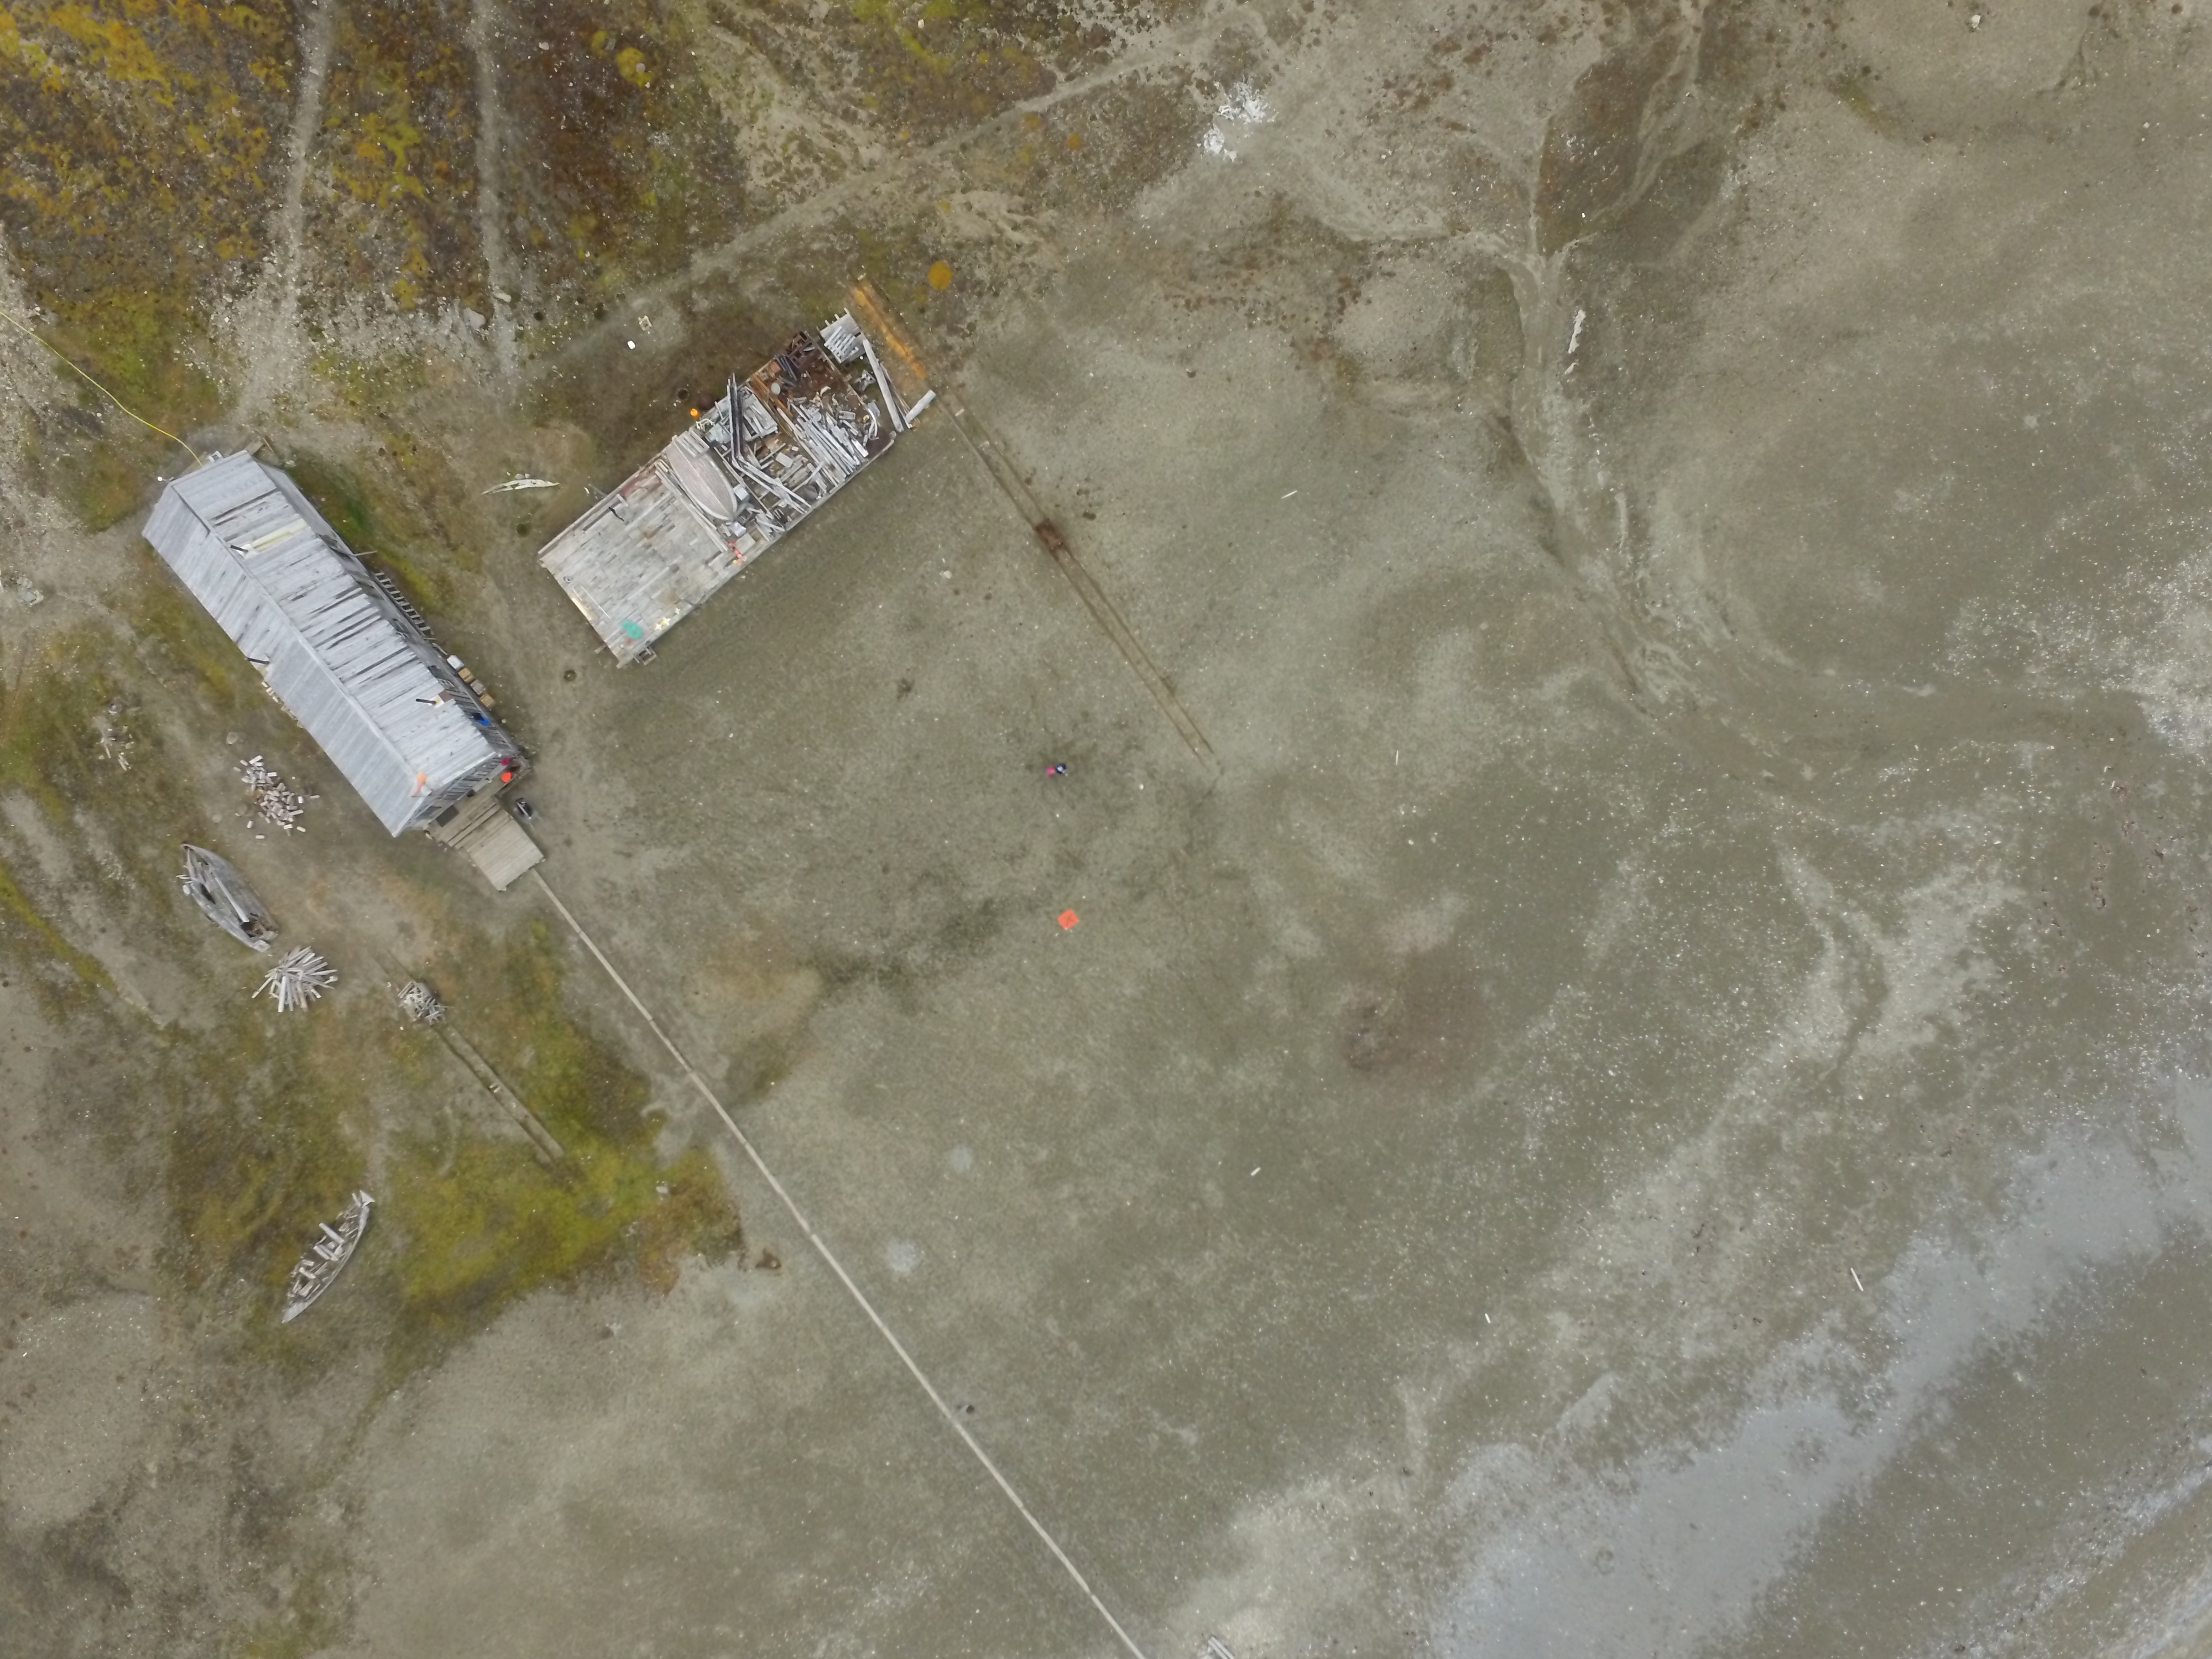
Time-lapse cameras In order to determine the state of coverage of the area, e.g. period of snow cover on a tundra, the extent of the glacier front, etc., it is necessary to perform photographic imaging at a specific time interval. This will allow for precise diagnosis of snow conditions. CRIOS – Cryosphere Integrated Observation Network on Svalbard Project financed from the EEA Financial Mechanism 2014-2021 operated by the National Science Centre in Poland Agreement no. UMO-2022/43/7/ST10/00001 to a predefined project no. 2022/43/7/ST10/00001 Project period: 08.09.2022 - 30.04.2024 (2029)
-
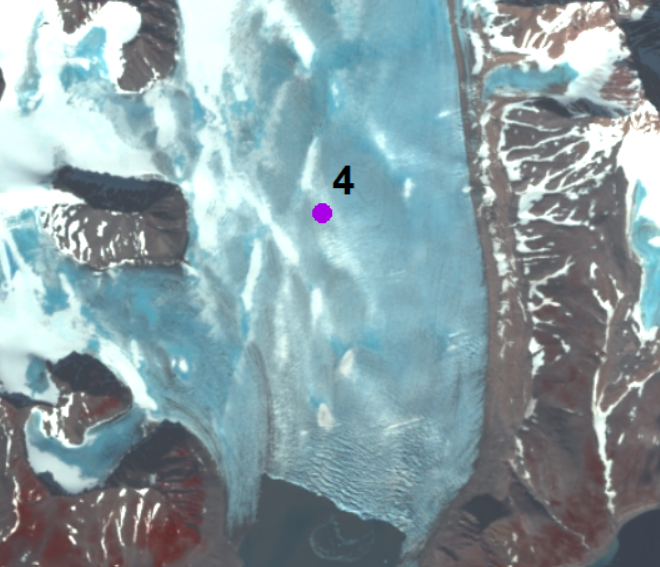
The annual velocity of Hansbreen in the period 2007–2015 is determined at stake No. 4 located approximately 3.5 km upstream of the glacier terminus (15°28`E, 77°02`N). Monitoring of the glacier is conducted by Institute of Geophysics Polish Academy of Science. The stake position was measured by the differential GPS receiver at the turn of each year (December/January) (with a horizontal accuracy of ±4 cm). Velocity along the Hansbreen terminus in 2009 and 2015 is processed from repeated terrestrial laser scanning in August 2009 and August 2015. Values of displacements of the same features along the calving front (distinctive edges of crevasses) for approximately two weeks were provided with an accuracy of around 10 cm. The database is the supplement to the paper: Małgorzata Błaszczyk, Jacek A. Jania, Michał Ciepły, Mariusz Grabiec, Dariusz Ignatiuk, Leszek Kolondra, Aleksandra Kruss, Bartłomiej Luks, Mateusz Moskalik, Tadeusz Pastusiak, Agnieszka Strzelewicz, Waldemar Walczowski, Tomasz Wawrzyniak. “Factors controlling terminus position of Hansbreen, a tidewater glacier in Svalbard”, Journal of Geophysical Research - Earth Surface, https://doi.org/10.1029/2020JF005763.
-
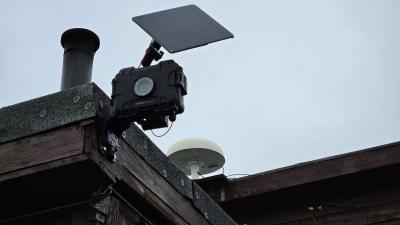
Time-lapse cameras In order to determine the state of coverage of the area, e.g. period of snow cover on a tundra, the extent of the glacier front, etc., it is necessary to perform photographic imaging at a specific time interval. This will allow for precise diagnosis of snow conditions. The camera is installed at the main entrance to the NCU Polar Station. The lens is pointed in a westerly direction, towards Prins Karls Forland CRIOS – Cryosphere Integrated Observation Network on Svalbard Project financed from the EEA Financial Mechanism 2014-2021 operated by the National Science Centre in Poland Agreement no. UMO-2022/43/7/ST10/00001 to a predefined project no. 2022/43/7/ST10/00001 Project period: 08.09.2022 - 30.04.2024 (2029)
-
%20data%20for%20Fuglebergsletta%20area.jpg)
Point cloud collected using the Riegl VZ®-6000 long-range terrestrial laser scanner. The TLS survey was carried out on 15th August 2021. The dataset is the result of relative and absolute registration of four point clouds. The dataset is the supplement to the paper: Błaszczyk, M.; Laska, M.; Sivertsen, A.; Jawak, S.D. Combined Use of Aerial Photogrammetry and Terrestrial Laser Scanning for Detecting Geomorphological Changes in Hornsund, Svalbard. Remote Sens. 2022, 14, 601. https://doi.org/10.3390/rs14030601
-
The database contains irregular meteorological data collected from the Hans Glacier (Hansbreen) in the years 2007-2017 as part of the polar expeditions of the University of Silesia in Spitsbergen / Svalbard. Data from three automatic weather stations. Measured elements: air temperature, air humidity, wind direction, wind speed, elements of radiation balance, others.
-
1. Dataset of UAV vertical aerial photos of Calypsobyen obtained from height of: 100m (58 photos), 60m (45 photos) and 30m (59 photos). Used UAV: Phantom 3 Advanced, date of acqusition: 16 Aug 2016. 2. Dataset of UAV vertical aerial photos of Paierlbreen east morain/dead ice obtained from height of 50m (152 photos). Area covered: ~250x~130m (with gaps).Used UAV: Phantom 3 Advanced, date of acqusition: 22 Aug 2016. 3. Dataset of UAV vertical aerial photos of Storbreen, close to Komsa (52 photos). Area covered: ~350x~230m. Used UAV: Phantom 3 Advanced, date of acqusition: 21 Aug 2016. 4. Dataset of UAV vertical aerial photos of Werenskoildbreen's south moraine (300 photos). Area covered: ~200x~350m and ~250x~250m. Used UAV: Phantom 3 Advanced, date of acqusition: 7 Sep 2016.
-
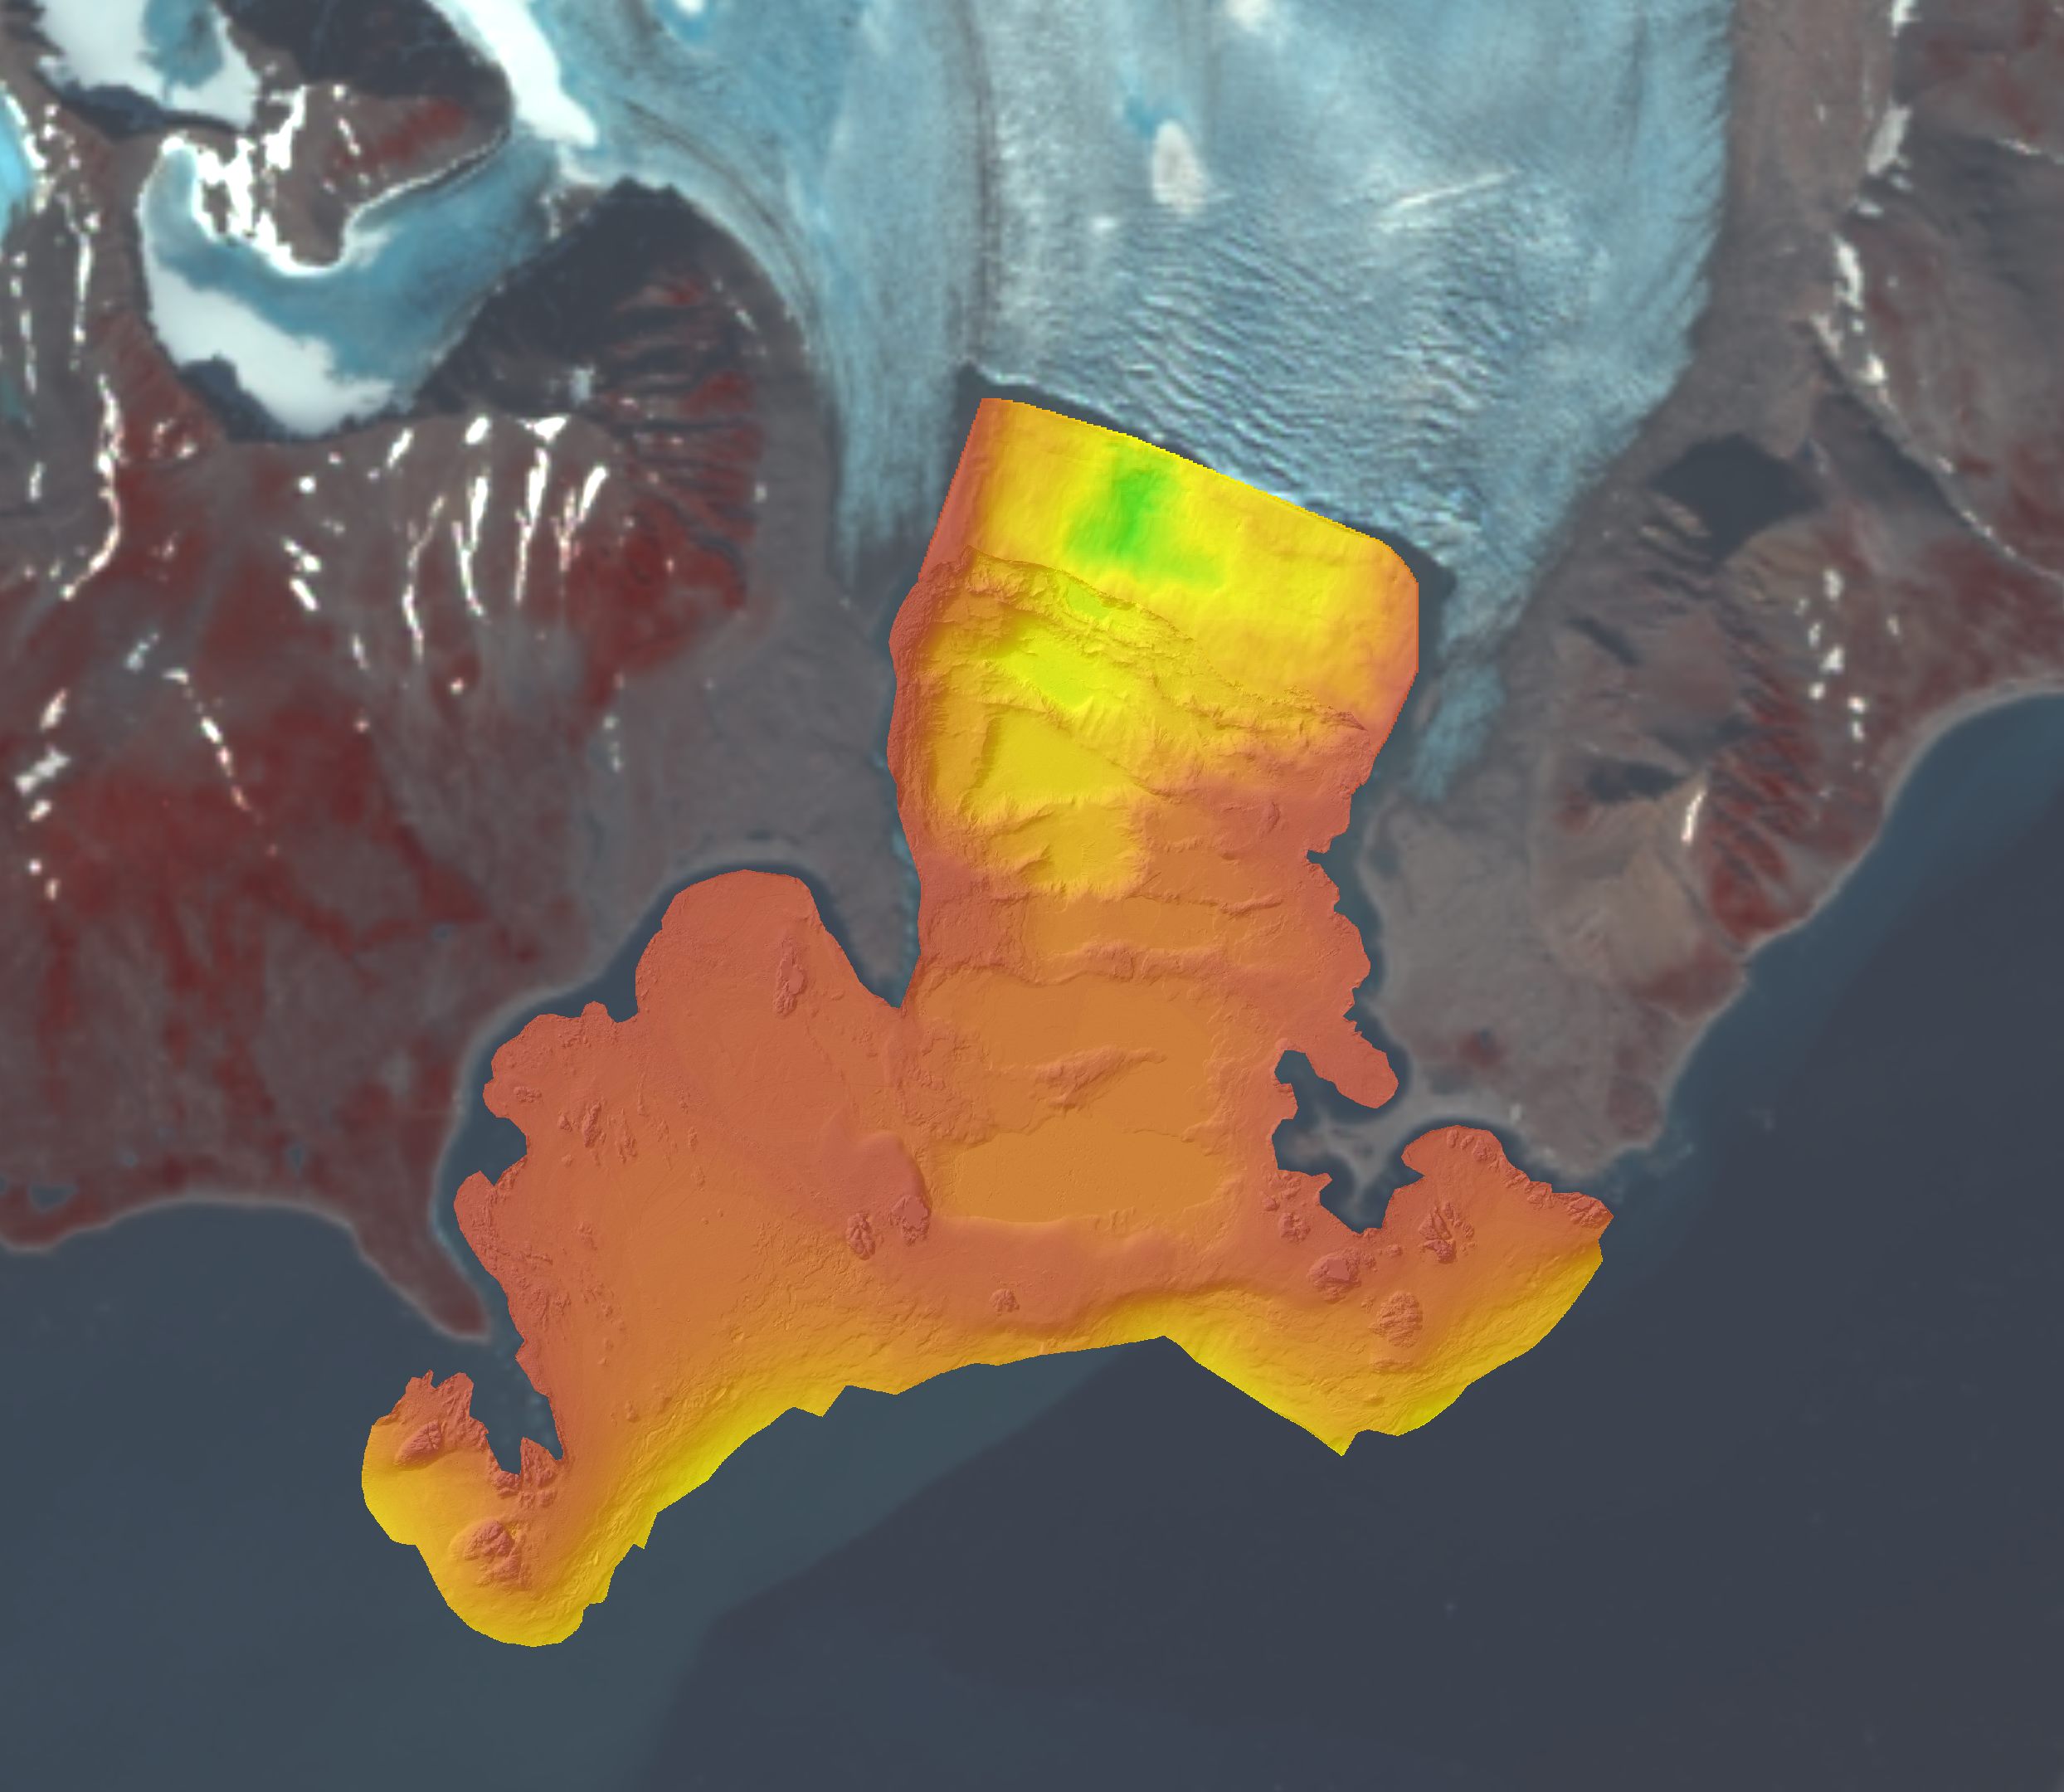
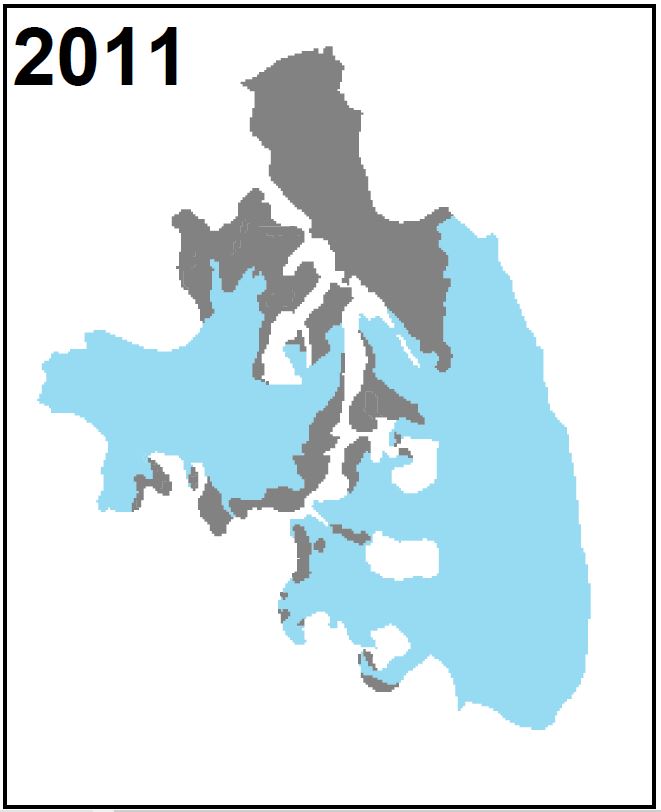
Bathymetry at the front of tidewater glaciers derived from different sources. Bathymetry data in Hansbukta and Burgerbukta have been collected by the Norwegian Hydrographic Service using a multi-beam survey during 2007–2008. Later measurements in Hansbukta were collected with single beam profiling at the Hansbreen front in 2015. Data format: grid (6m), UTM 33X. Single echo-sounding data collected during summer 2011, by the University of Silesia.
-
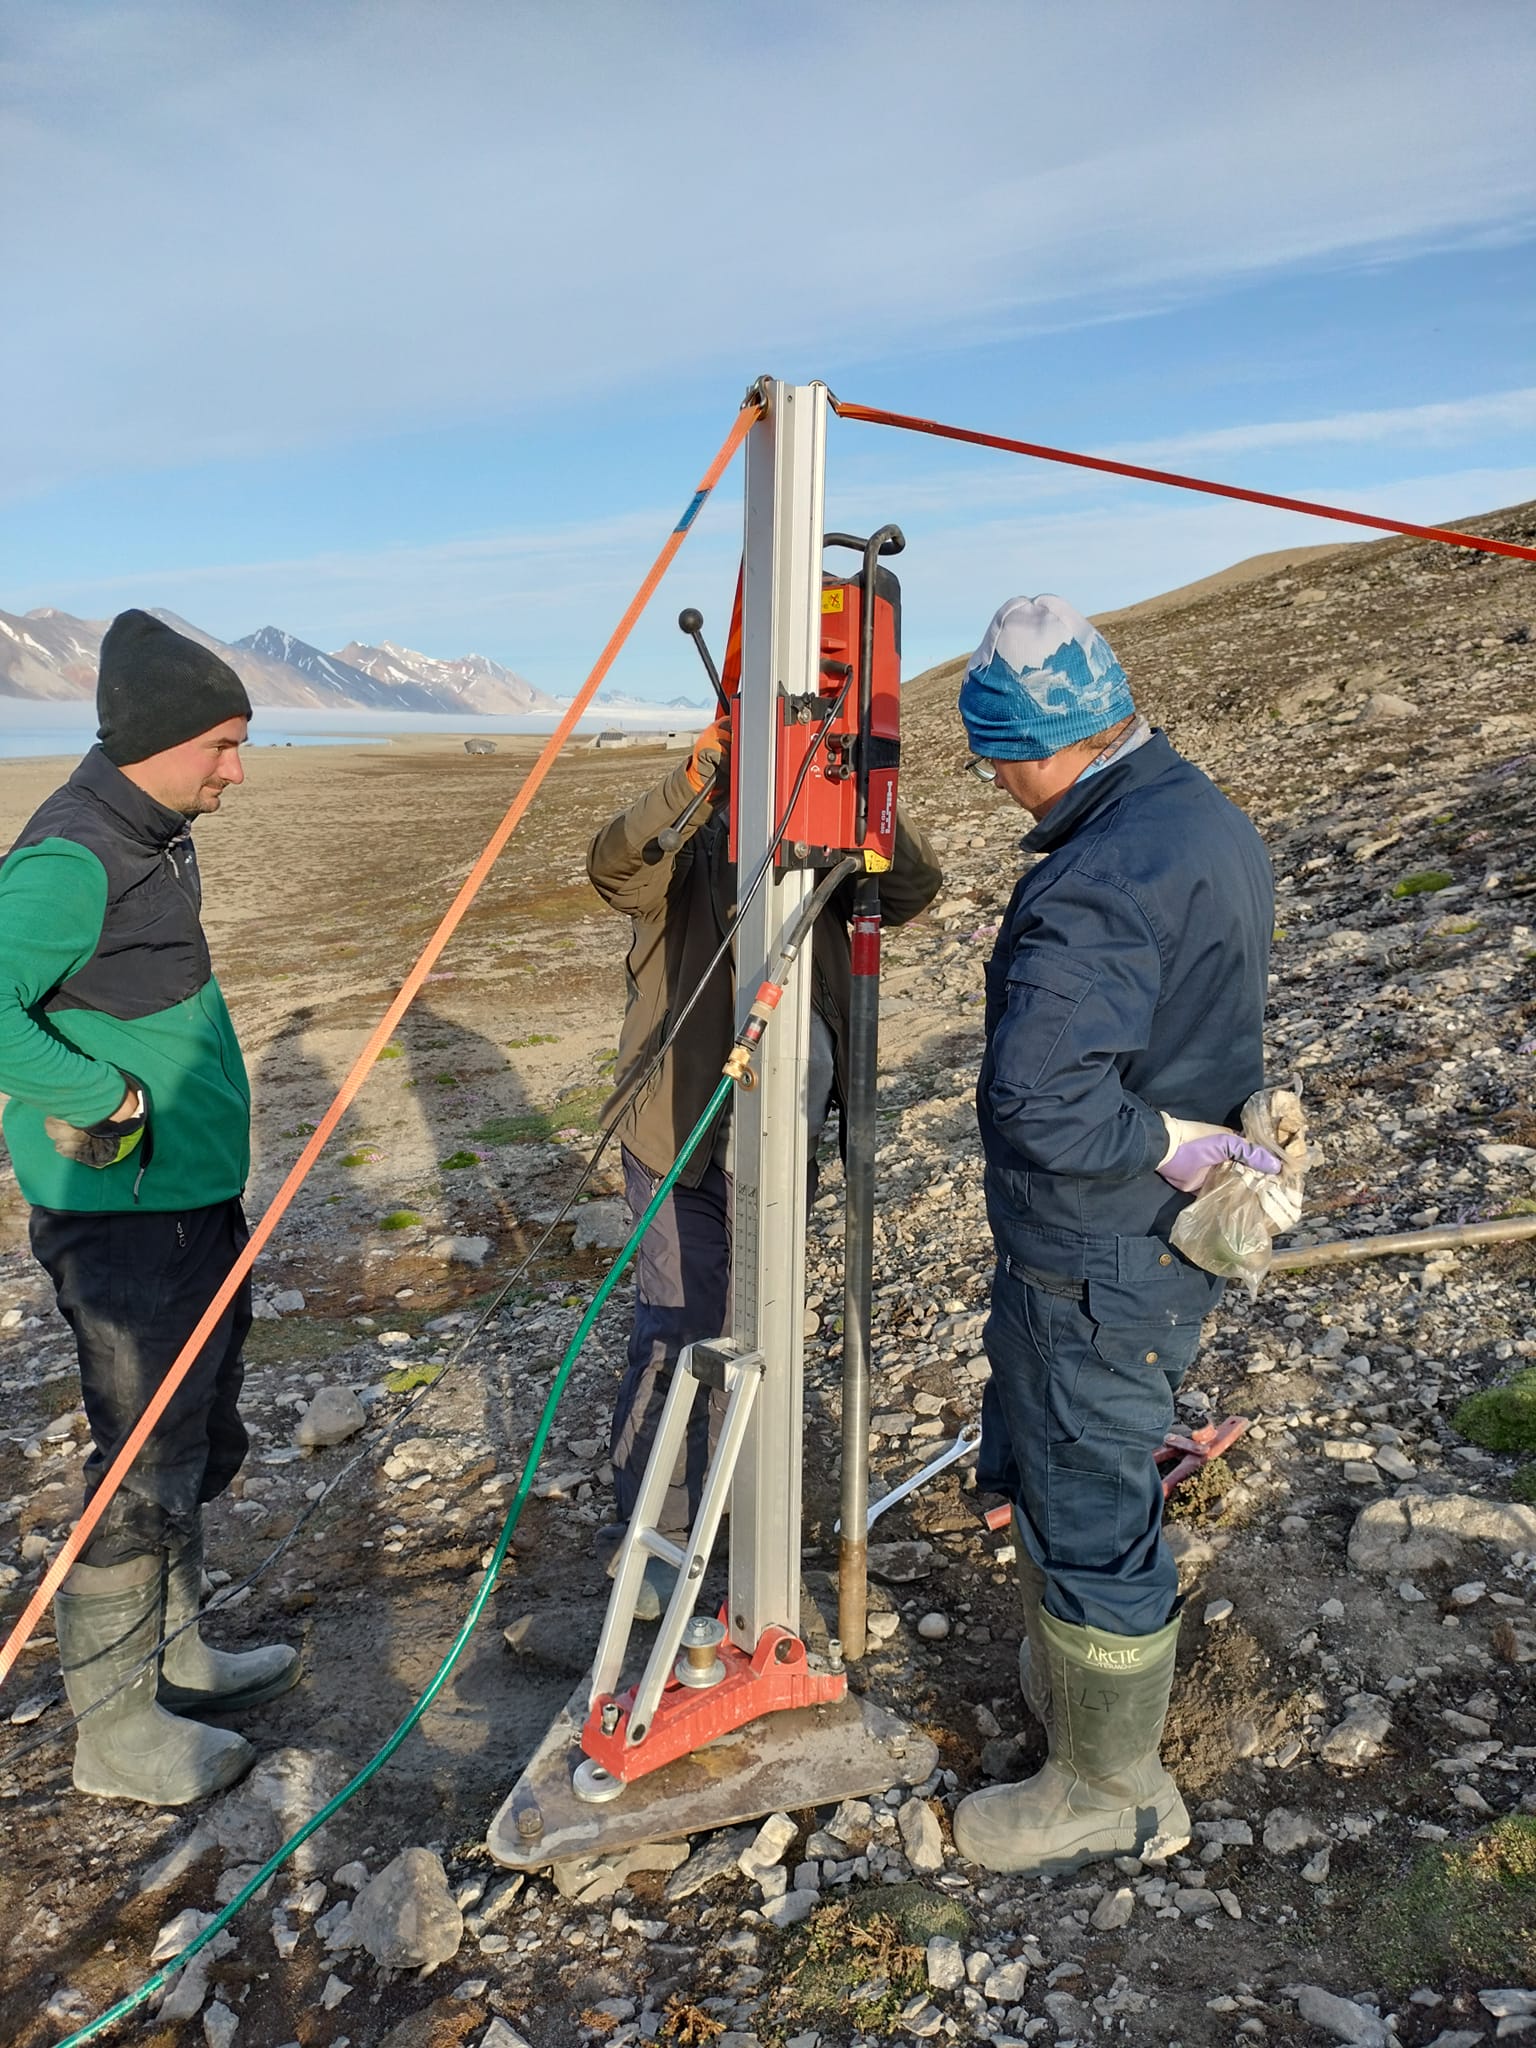
Permafrost monitoring System of thermistors (temperature strings with loggers) to monitor the ground thermal state Precise data on the thermal state of the frozen ground is one of the key missing components of the environmental monitoring at the research stations spread across Spitsbergen. The CRIOS project will allow us to equip the newly established borehole with precise temperature strings that will record ground thermal changes over the next couple of years. A system of temperature strings will be used in the monitoring of the thermal state of permafrost in drilled boreholes. Devices were tested in severe weather and are commonly used for permafrost monitoring by other research groups working in polar regions. The hole in the vicinity of the UAM station in Petuniabukta was delineated at a distance of about 50 m from the shoreline, in the zone between the Polish and Czech stations. The drilling was carried out on 22-23.07.2023. The bedrock is built up by siltstone and sandstone. At the drilling site, they are covered by thick-bedded beach sediments. During the drilling, a depth of 7 meters below sea level was reached, and with no further drilling progress, a decision was made to install a string to the depth obtained. CRIOS – Cryosphere Integrated Observation Network on Svalbard Project financed from the EEA Financial Mechanism 2014-2021 operated by the National Science Centre in Poland Agreement no. UMO-2022/43/7/ST10/00001 to a predefined project no. 2022/43/7/ST10/00001 Project period: 08.09.2022 - 30.04.2024 (2029)
-
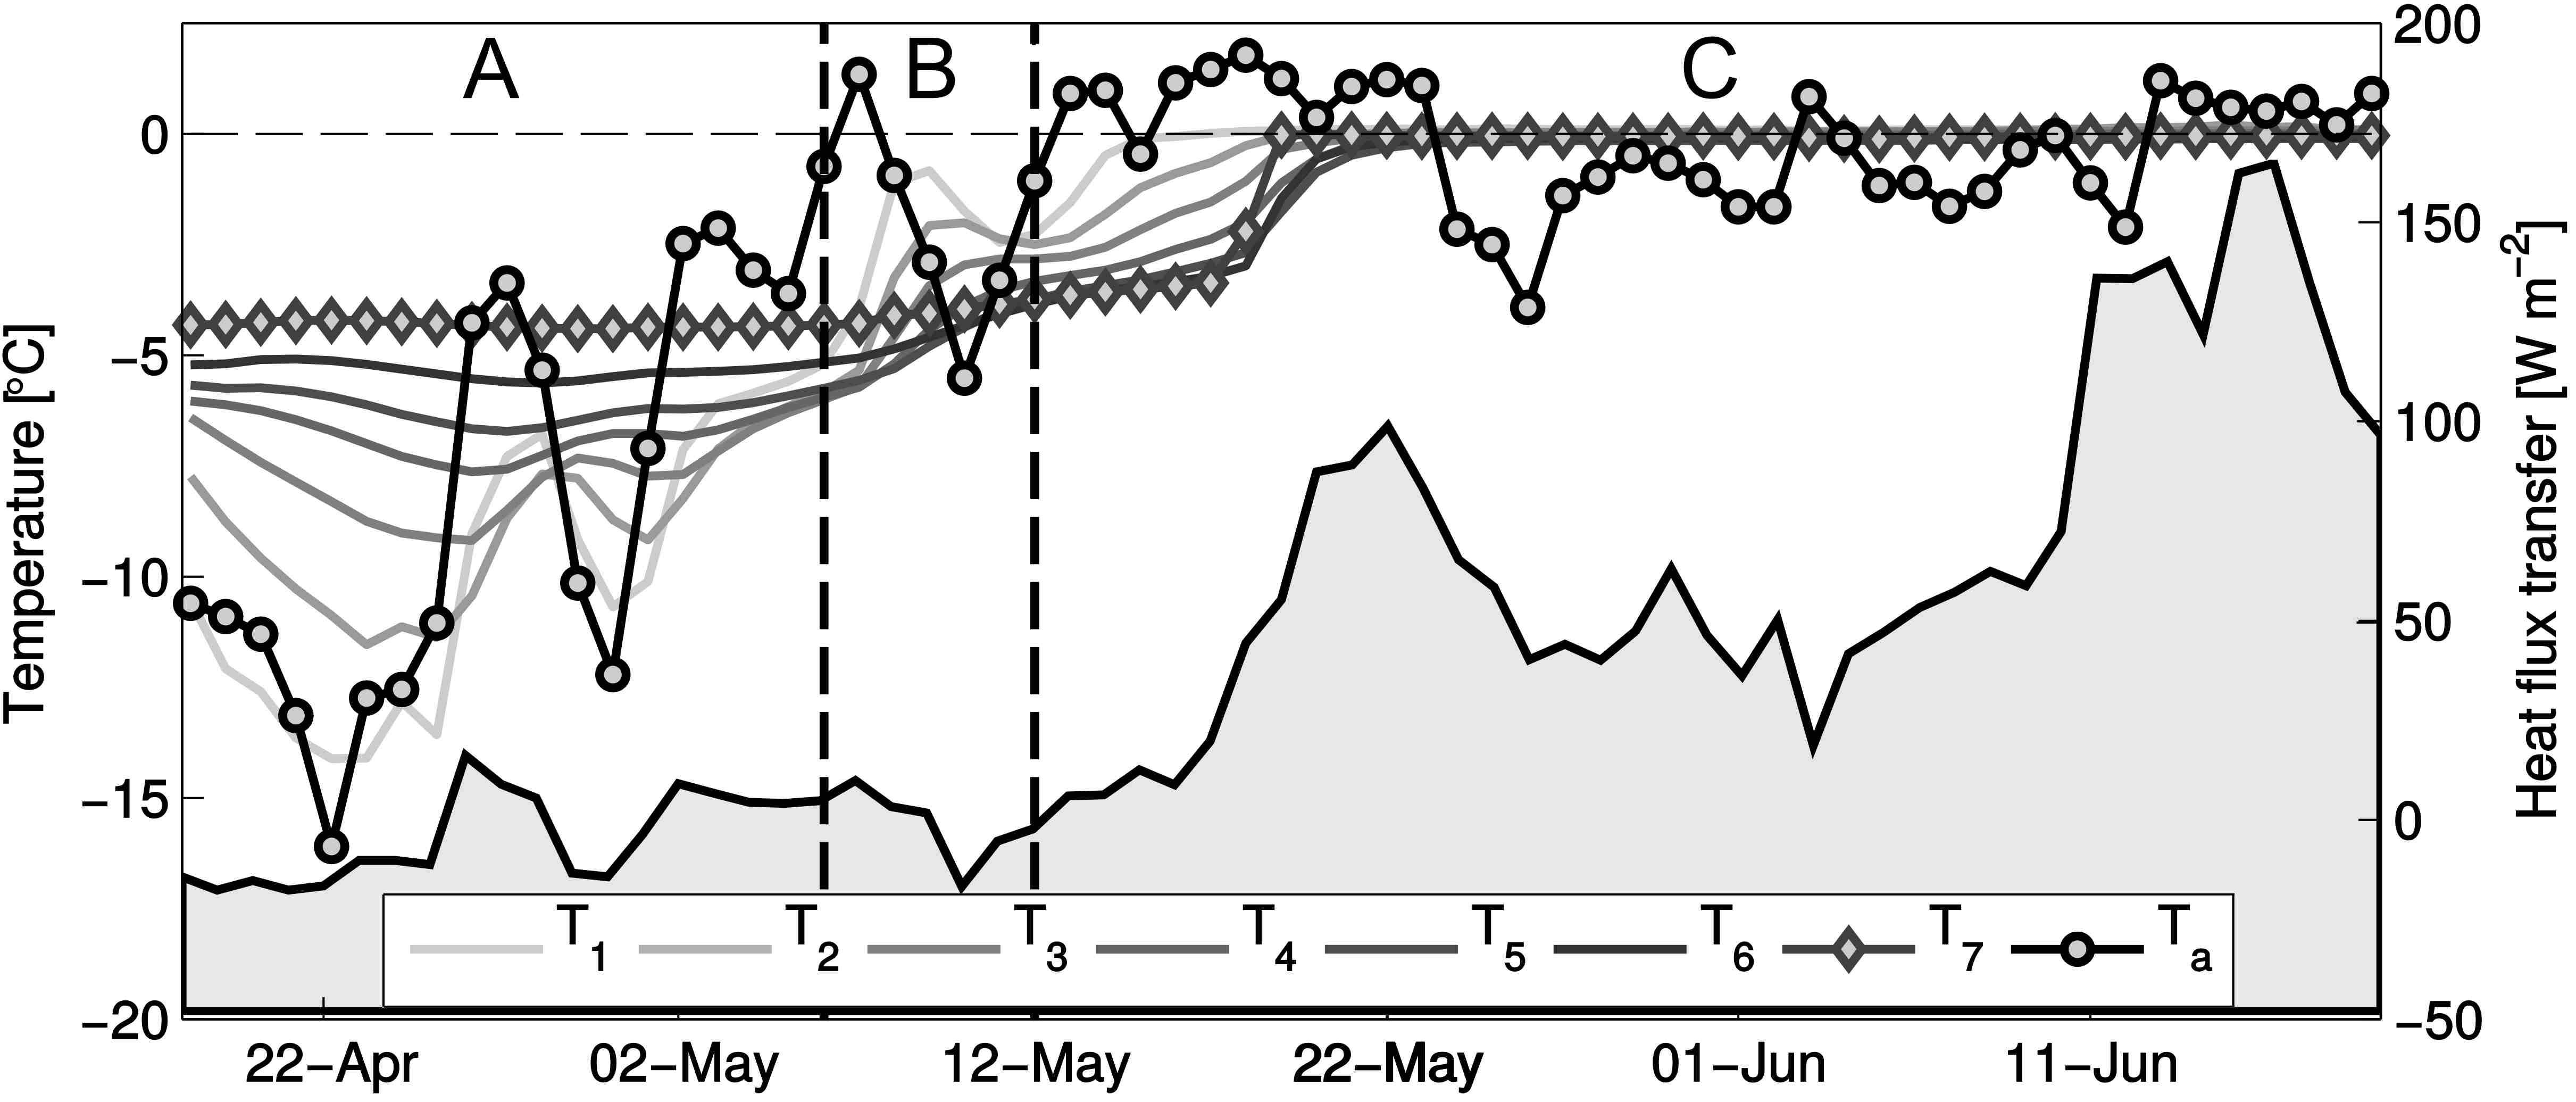
Dataset contains evolution of the snow temperature within seasonal snowpack on Hansbreen. Fieldwork has been performed with several thermistors located at different levels (from snow surface to the bottom, on glacier ice) from April to July 2010 (during period of early and intensive surface melting). Study has been repeated in 2015, at the same location. Acknowledgements: Research Council of Norway, Arctic Field Grant 2013: Spatial distribution of snow cover and drainage systems on the glaciers on Wedel Jarlsberg Land (RiS ID: 6158); the National Science Centre PRELUDIUM 4: Role of meltwater from snow cover for supplying drainage systems of the Spitsbergen glaciers (2012/07/N/ST10/03784) References: Laska M., Luks B., Budzik T., 2016. Influence of snowpack internal structure on snow metamorphism and melting intensity on Hansbreen, Svalbard. Polish Polar Research, 37(2): 193–218. doi:10.1515/popore-2016-0012
-
Firn extents of Hansbreen and Werenskoildbreen delivered from unsupervised classifications of single, dual and fully-polarimetric SAR data (ALOS-2 PALSAR, RADARSAT-2, Sentinel-1, ERS-2 SAR) between 2011 and 2017. Methods of classification: unsupervised ISO classification, H-a Wishart Classification. Results validated with terrestrial measurements (shallow ice cores drilling, Ground Penetrating Radar measurements). Research supported by the European Space Agency, Third Party Missions grant and Svalbard Science Forum, Arctic Field Grant 2018. For more details, please e-mail to this adress: bbarzycka@us.edu.pl.