 Centre for Polar Studies
notPlanned
Type of resources
Topics
Keywords
Contact for the resource
Provided by
Representation types
Update frequencies
status
-
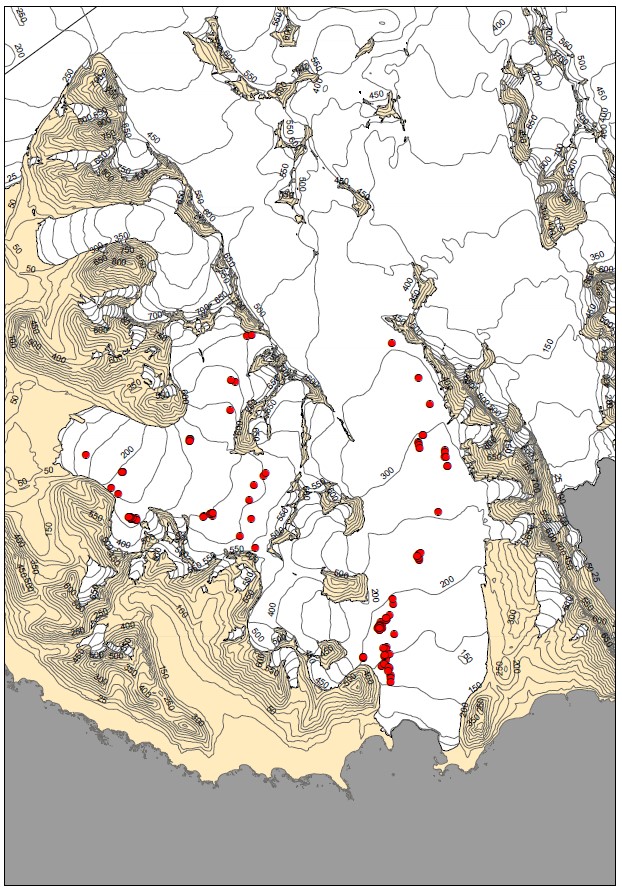
Dataset contains location of glacial shafts (moulins) on two polythermal glaciers: Werenskioldbreen and Hansbreen. Fieldwork has been done with GPS device at the end of ablation season in 2015. Acknowledgements: Research Council of Norway, Arctic Field Grant 2013: Spatial distribution of snow cover and drainage systems on the glaciers on Wedel Jarlsberg Land (RiS ID: 6158); the National Science Centre PRELUDIUM 4: Role of meltwater from snow cover for supplying drainage systems of the Spitsbergen glaciers (2012/07/N/ST10/03784)
-
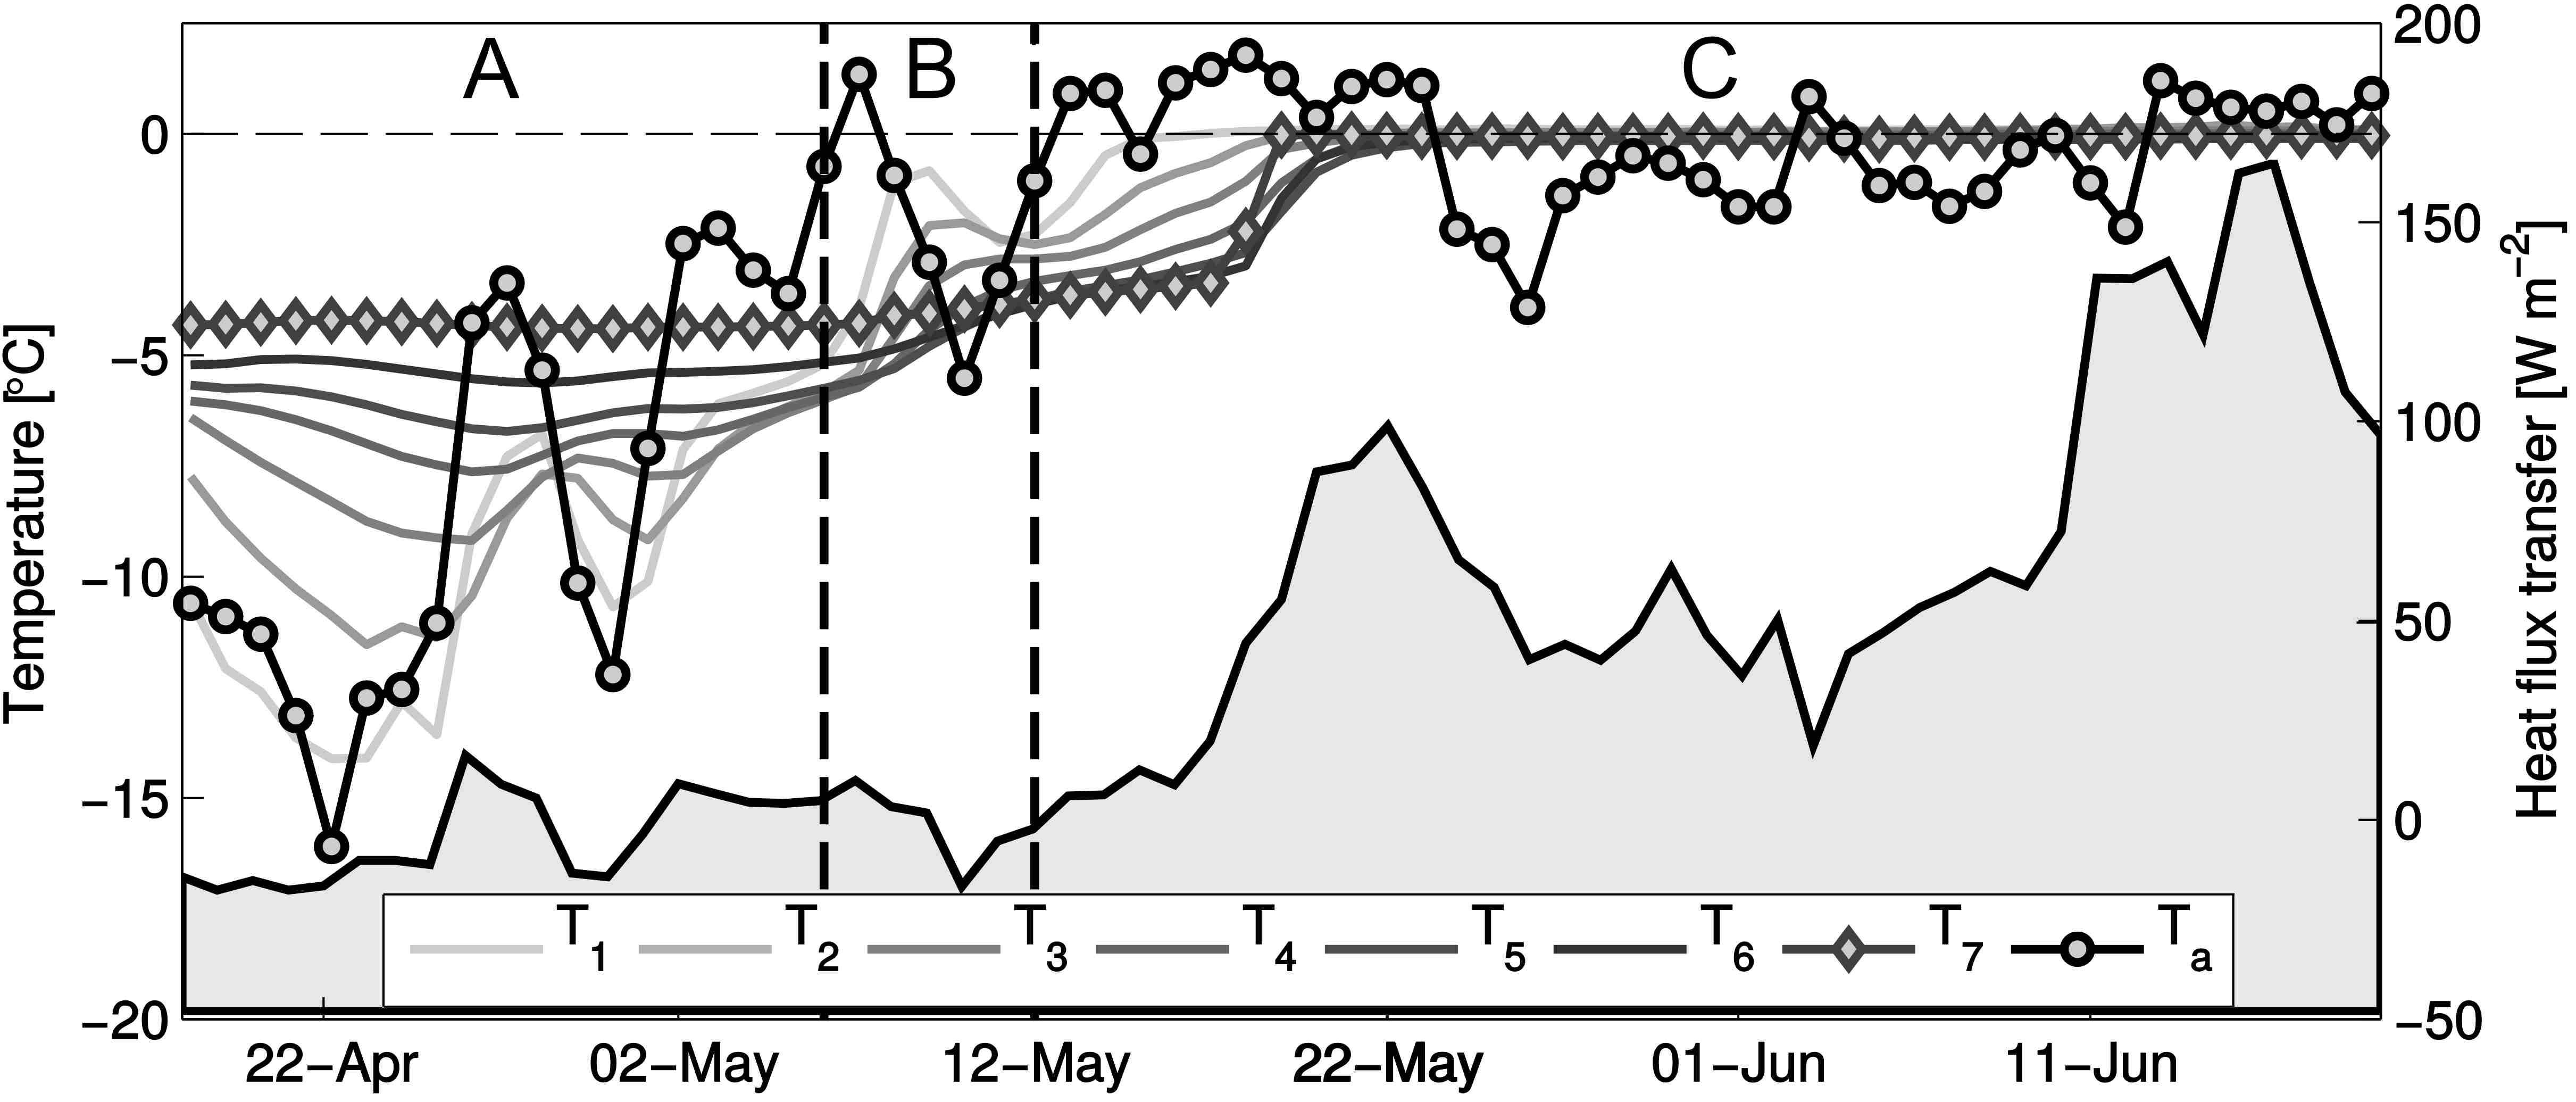
Dataset contains evolution of the snow temperature within seasonal snowpack on Hansbreen. Fieldwork has been performed with several thermistors located at different levels (from snow surface to the bottom, on glacier ice) from April to July 2010 (during period of early and intensive surface melting). Study has been repeated in 2015, at the same location. Acknowledgements: Research Council of Norway, Arctic Field Grant 2013: Spatial distribution of snow cover and drainage systems on the glaciers on Wedel Jarlsberg Land (RiS ID: 6158); the National Science Centre PRELUDIUM 4: Role of meltwater from snow cover for supplying drainage systems of the Spitsbergen glaciers (2012/07/N/ST10/03784) References: Laska M., Luks B., Budzik T., 2016. Influence of snowpack internal structure on snow metamorphism and melting intensity on Hansbreen, Svalbard. Polish Polar Research, 37(2): 193–218. doi:10.1515/popore-2016-0012
-
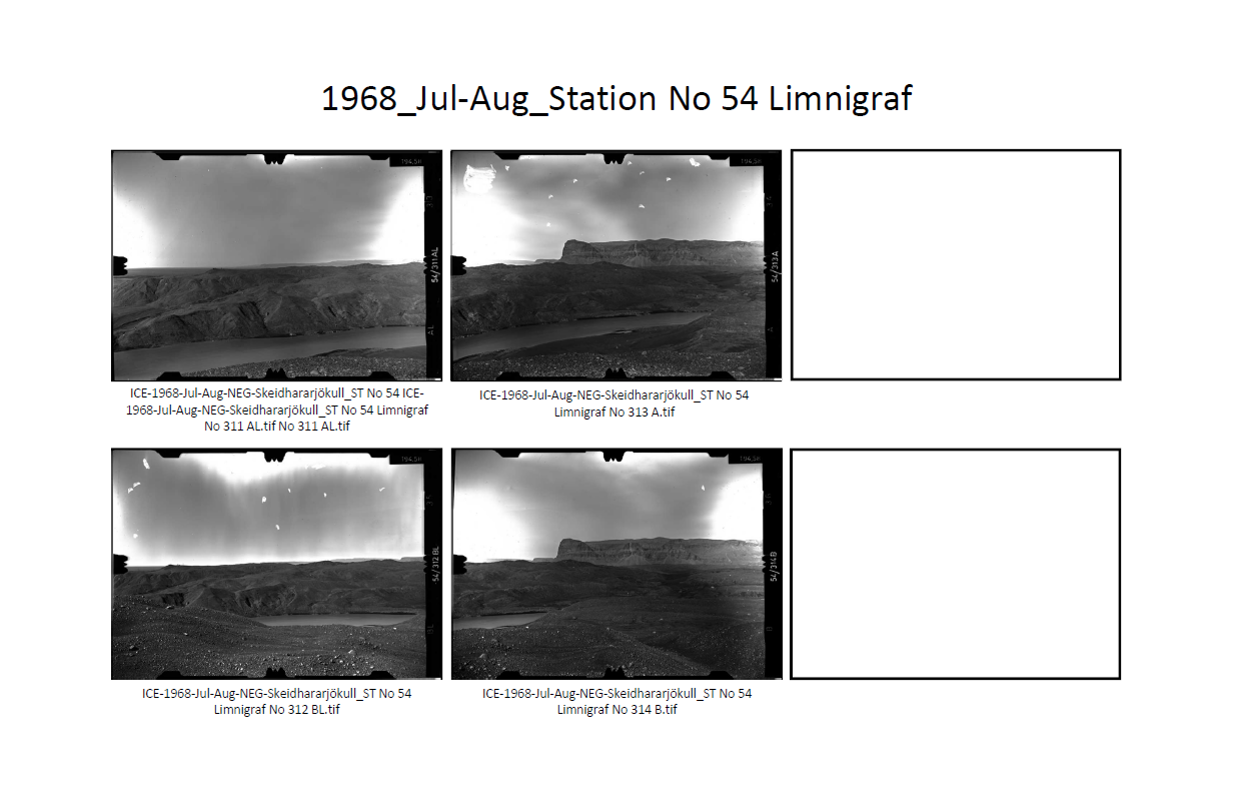
The base contain: 1. List (*xls) of terrophotogrammetric photographs taken by member of Polish Expedition on Iceland in 1968 (zone of Skeidarárjökull). 2. Skaning above photographs with resolution of 2400 dpi, file format *.tif and *.jpg (400 dpi). All photographs were taken by means of instrument type Phototheodolite Zeiss 19/1318 on glass plates. Authors of photographs: Tadeusz Konysz. Fot better identification of all photographs was prepared presentations (in *.pptx and *.pdf formats), where photographs there are arranged in in common practise, classic form used for terrophotogrammetric stereoscopic photographs: A, AL, AR, B, BL, BR (the meaning of a letter: A - right photogrammetric station and photograph taken in normal case [90°]; B - left photogrammetric station and photograph taken in normal case [90°]; AL - photograph taken from right station in left direction; AR - photograph taken from right station in right direction; BL - photograph taken from left station in left direction; BR - photograph taken from left station in right direction). Other photographs (e.g. panoramic) has additional informations. All names of photogrammetric stations and name of objects (in Polish language) was taken from the author’s collection of data.
-
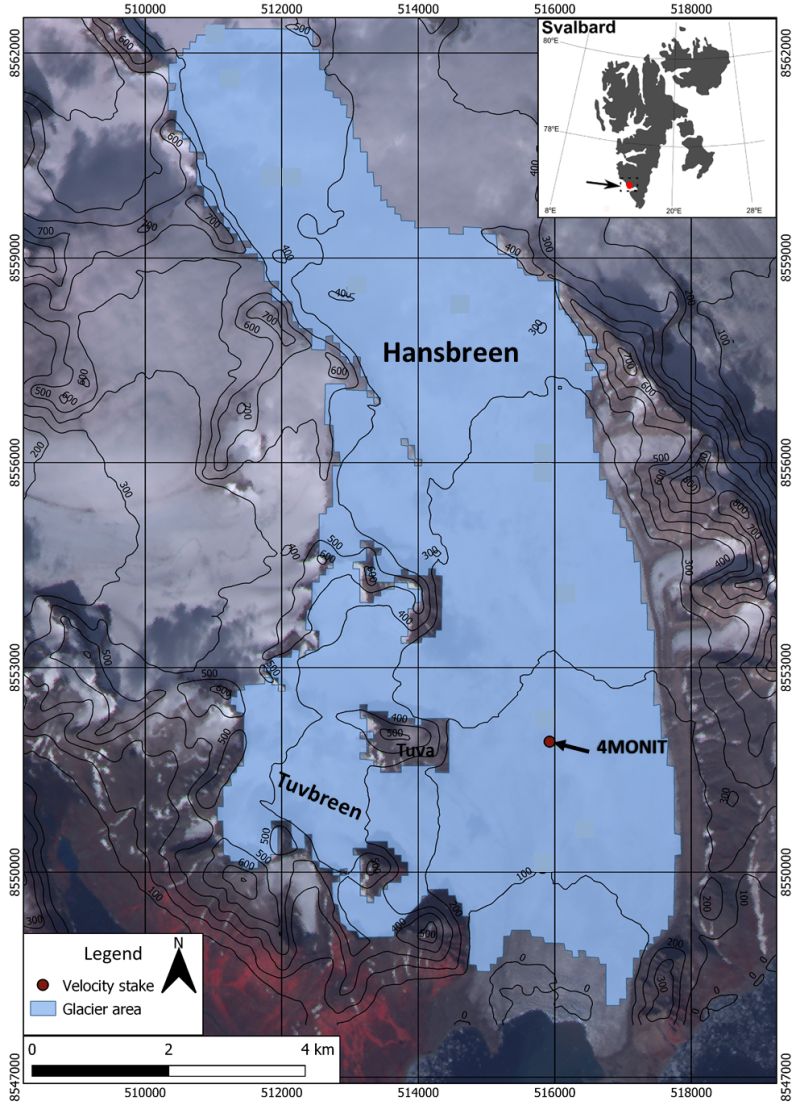
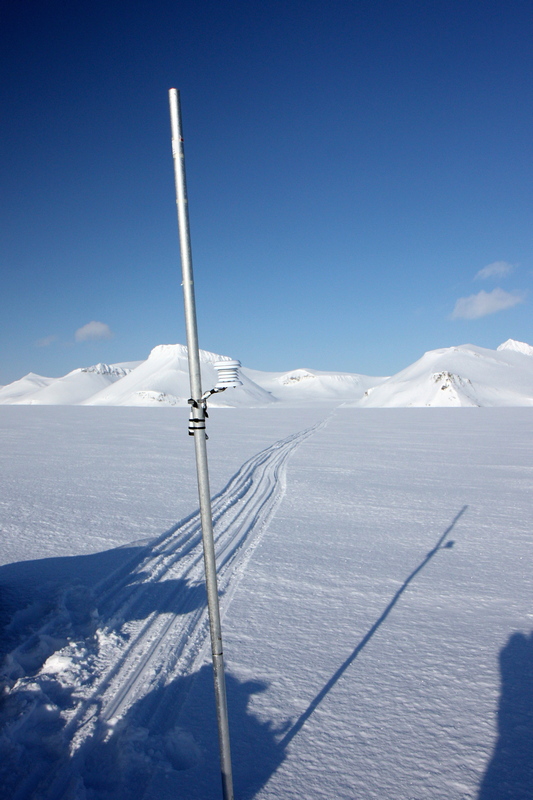
Hansbreen velocity is measured with a Global Navigation Satellite Systems (GNSS) receiver that sampled location every 3 hours at stake 4MONIT located approximately 3.5 km upstream of the glacier terminus (N77°02’ E15°28’). Monitoring of the glacier is conducted by Institute of Geophysics Polish Academy of Science. We calculate the daily speed based on each midnight positions (with a horizontal accuracy of ±4 cm).
-
Meteorological data from Flat Glacier (Flatbreen) - air temperature.
-
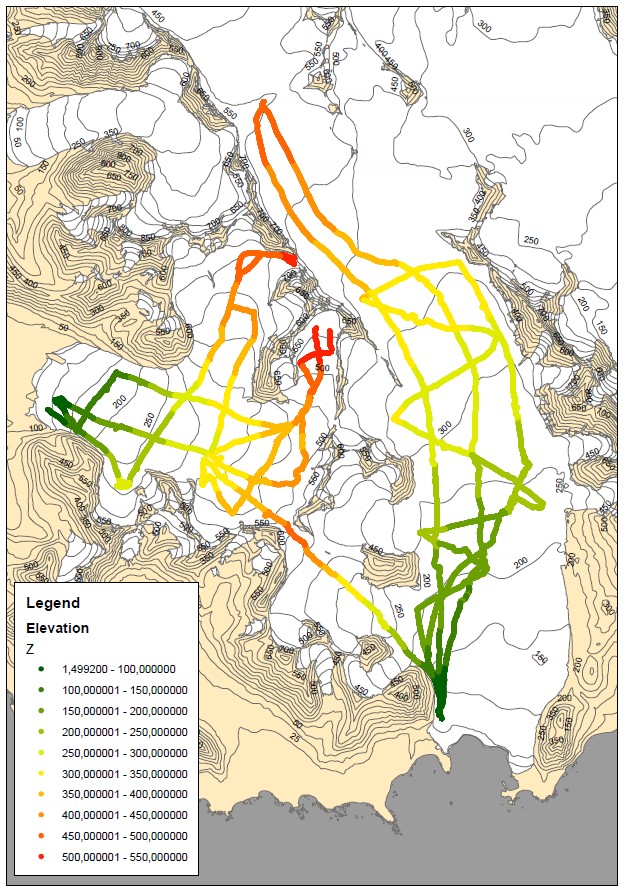
Dataset contains surface elevation along spring GPR profiles performed on Hansbreen and Werenskioldbreen. Fieldwork has been done with dGPS device in kinematic mode at the end of ablation season in 2013 and 2015 to compare it with spring GPR survey and calculate surface ablation. Acknowledgements: Research Council of Norway, Arctic Field Grant 2013: Spatial distribution of snow cover and drainage systems on the glaciers on Wedel Jarlsberg Land (RiS ID: 6158); the National Science Centre PRELUDIUM 4: Role of meltwater from snow cover for supplying drainage systems of the Spitsbergen glaciers (2012/07/N/ST10/03784)
-
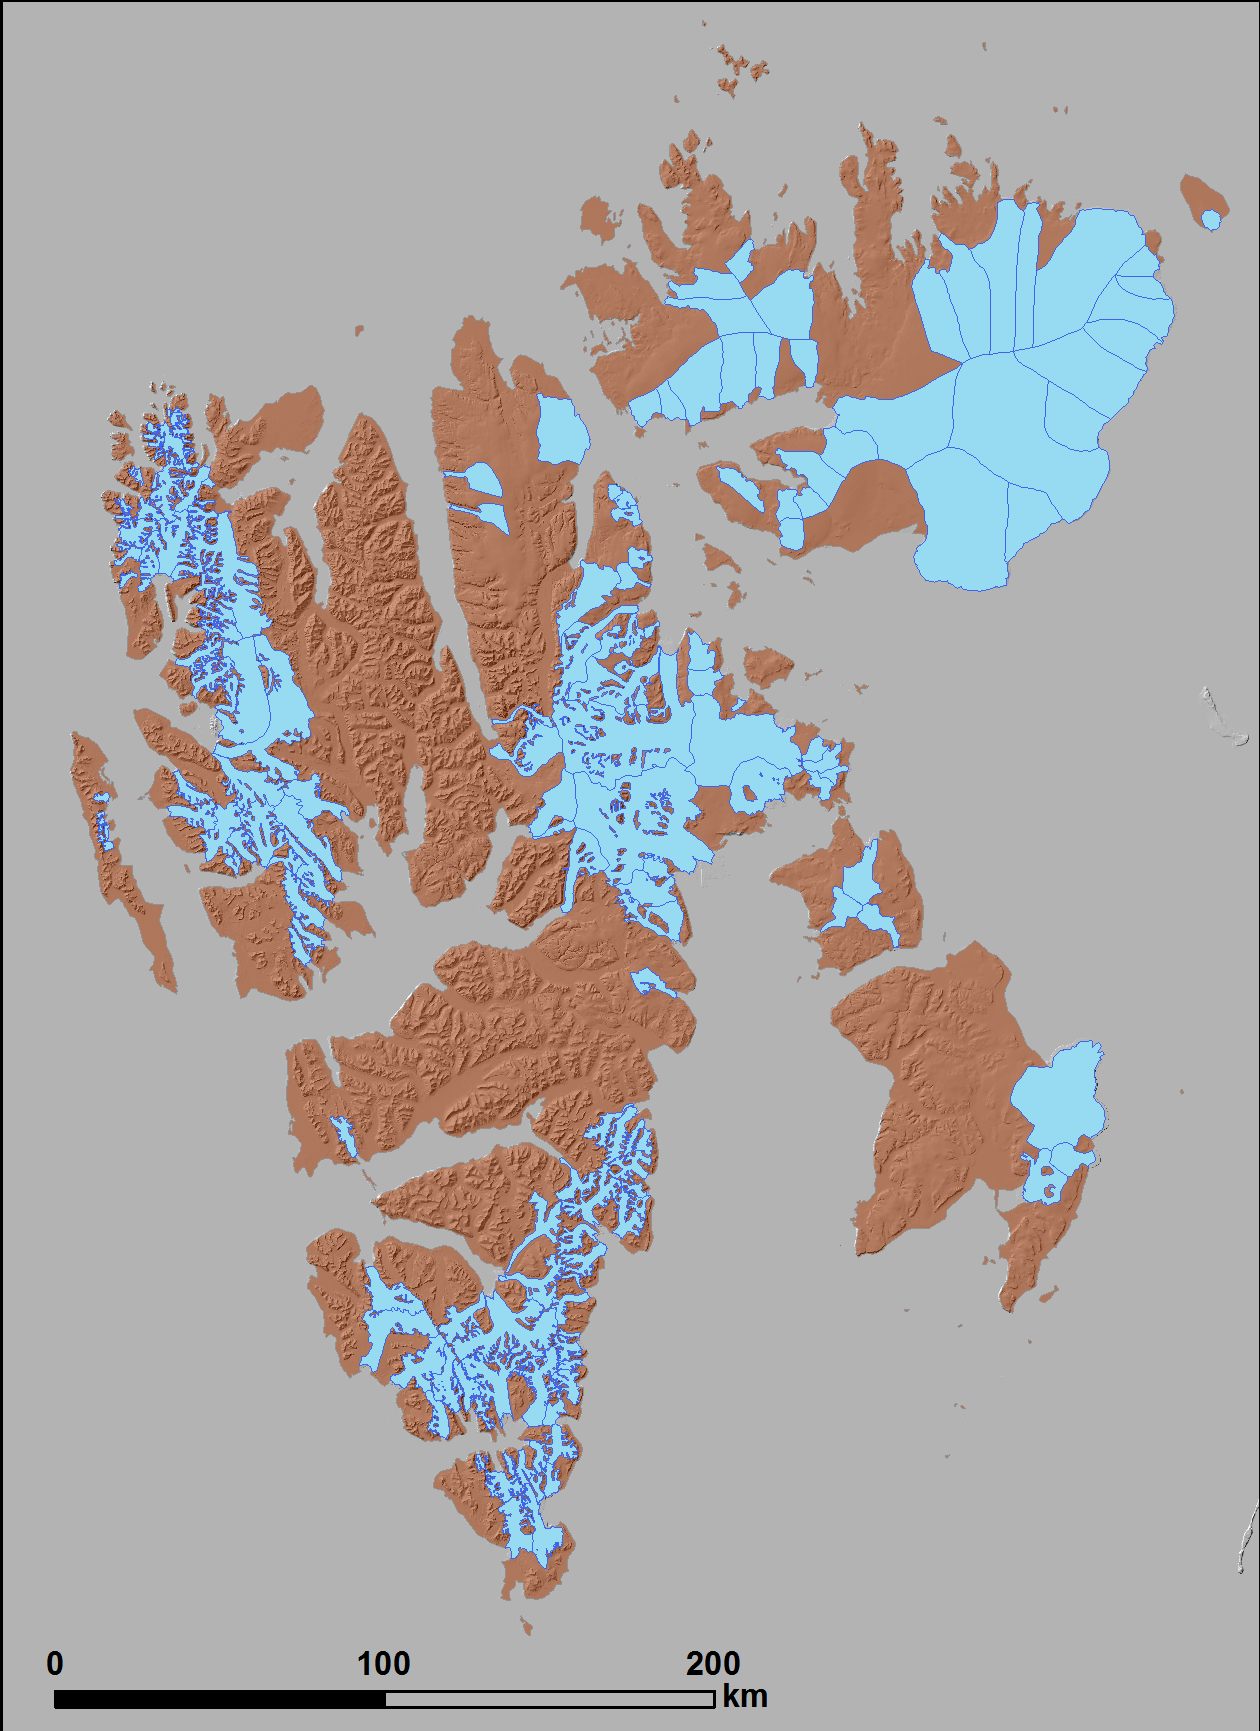
Inventory of tidewater glaciers delineated from archival satellite images (Aster, Landsat) acquired in the period 1999-2006. Shapefiles have basic information in the attribute table (name, ID, area, length, front type of tidewater glaciers). When a tidewater glacier has a compound basin, only that part of it feeding the calving front was taken into consideration and presented here as the tidewater glacier. This implies that tributary glaciers clearly separated from the main basin by moraines are not included in the database. Similarly, marginal sections of tidewater glaciers that terminate on land are not included in the Inventory. Detailed description of the source data and accuracy can be found in: Błaszczyk M., Jania J., Hagen J.O. 2009: Tidewater glaciers of Svalbard: Recent changes and estimates of calving fluxes. Polish Polar Research, 30(2): 85-142. http://www.polish.polar.pan.pl/ppr30/PPR30-085.pdf
-
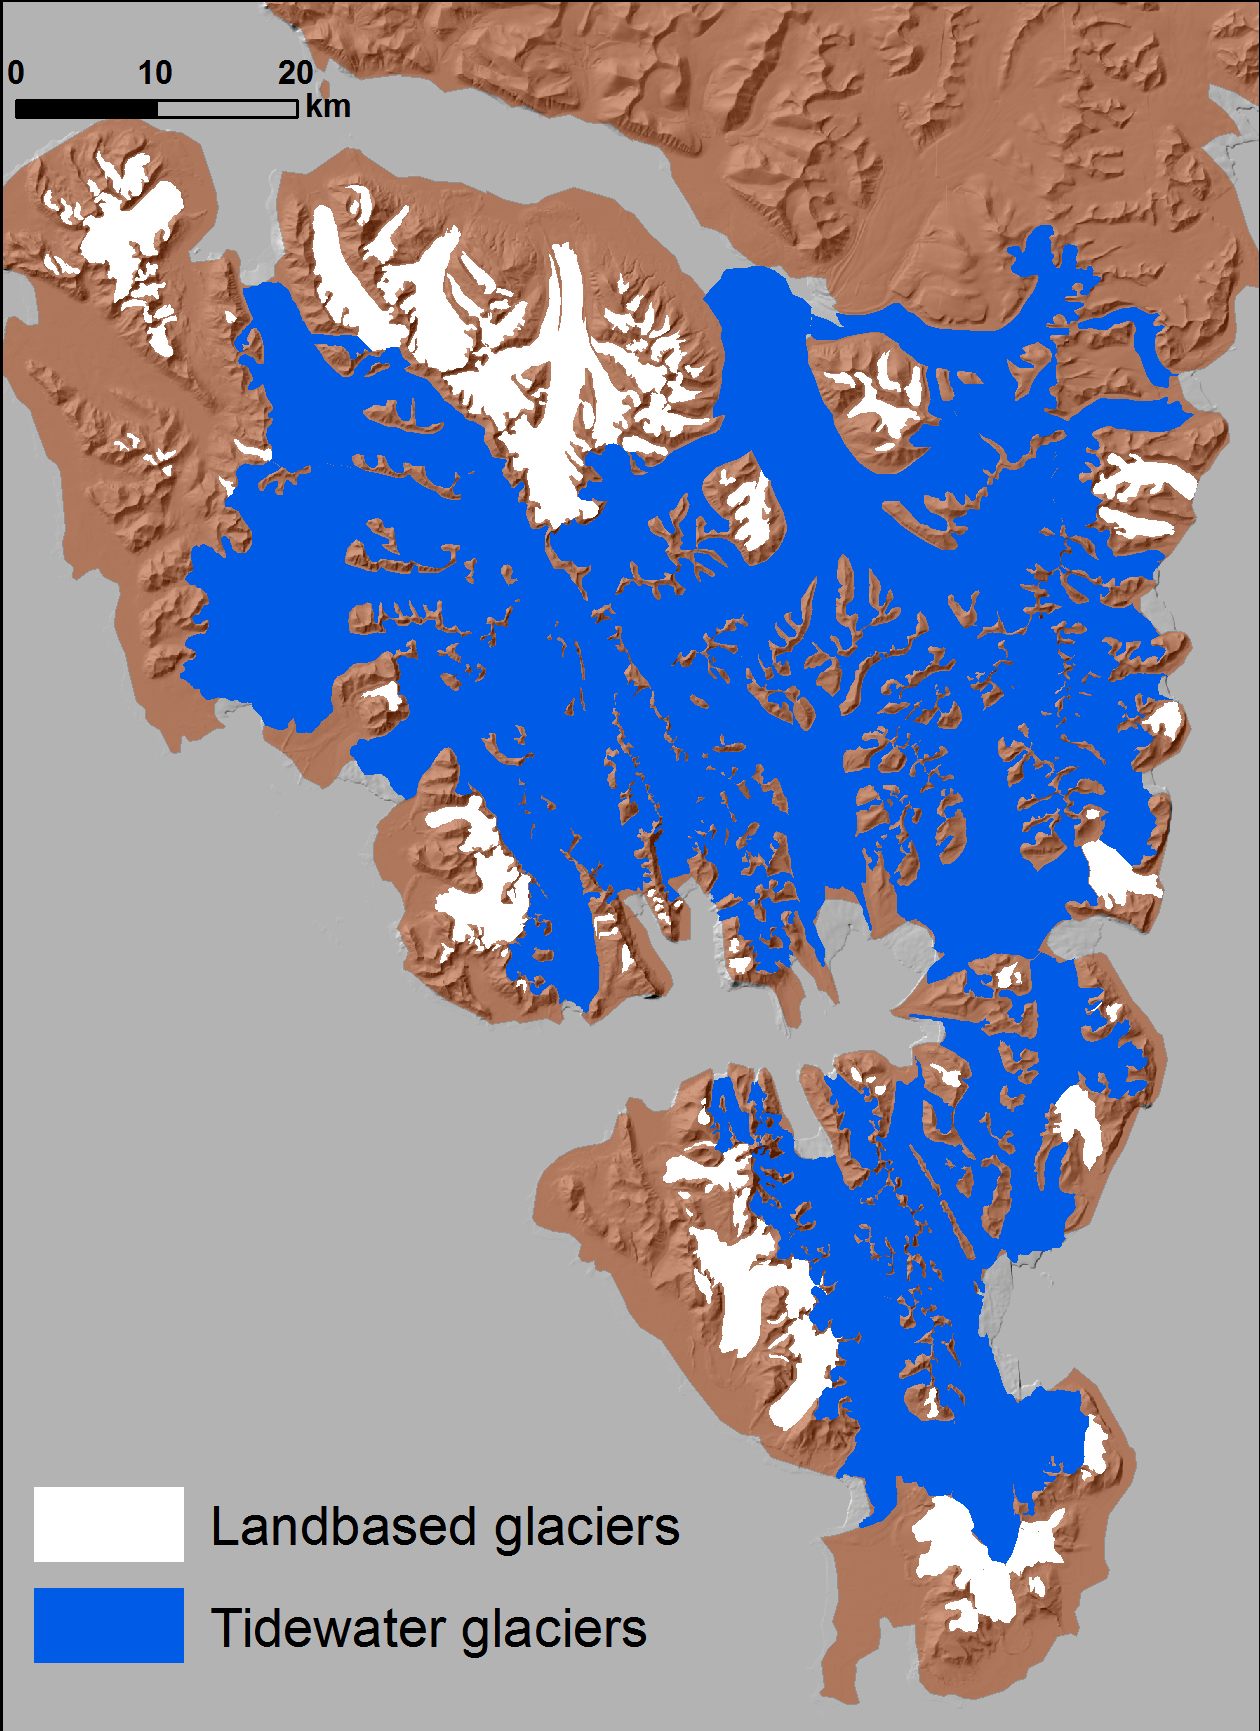
Inventory of tidewater and landbased glaciers delineated from archival satellite images (ASTER, Landsat) for Southern Spitsbergen. Tidewater glaciers are delineated based on satellite data from 2010. Landbased glacier are extracted from different satellite data (2005-2010). Shapefiles have basic information in the attribute table (name, ID, area, type of glaciers). Detailed description of the source data and accuracy data for glaciers from hydrological basin of Hornsund can be found in: Błaszczyk M., Jania J.A., Kolondra L., 2013: Fluctuations of tidewater glaciers in Hornsund Fiord (Southern Svalbard) since the beginning of the 20th century. Polish Polar Research, 34( 4): 327-352.http://journals.pan.pl/dlibra/publication/114504/edition/99557/content
-
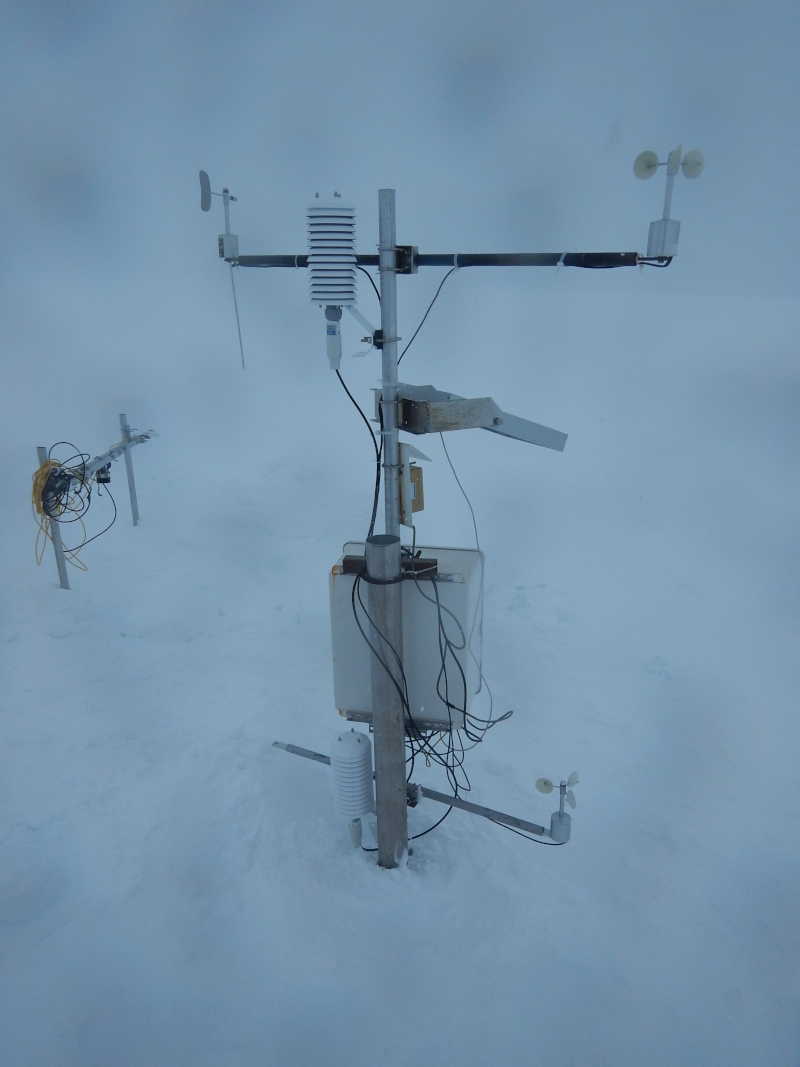
Air temperature is provided by AWS 4 (N77°02' E15°38', 183 m). Air temperature comes from a Campbell Scientific 107 sensor at +/- 0.1° C resolution and sampled every 10 minutes, averaged to daily resolution in post-processing.
-
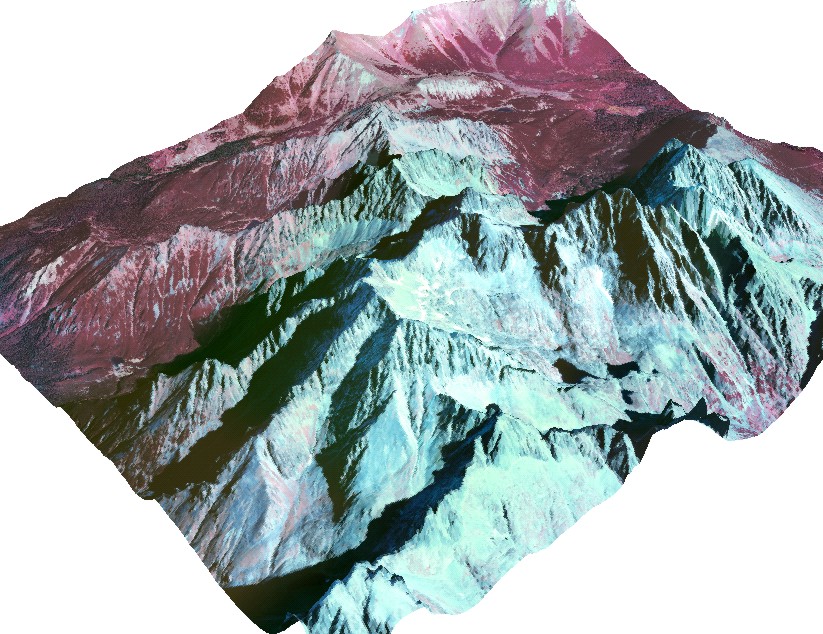
The orthophotomap was prepared on the basis of infrared aerial photographs taken by EUROSENSE in September 1998. The study covers the Dolina Kiezmarskej Bieley vody valley located in the High Tatra Mountains (Slovakia). Cartographic projection: Universal Transverse Mercator, Ellipsoid: WGS 84, Coordinates system: UTM zone 34. The project was financed by No.3P04E 045 23. Editors: Bogdan Gądek, Milan Koren (sen.), Milan Koren (jun.) The project was financed by the Polish Commitee on Scientific Research under term of research grant No. 3P04E 045 23.