 Centre for Polar Studies
Type of resources
Available actions
Topics
Keywords
Contact for the resource
Provided by
Years
Formats
Representation types
Update frequencies
status
Scale
-
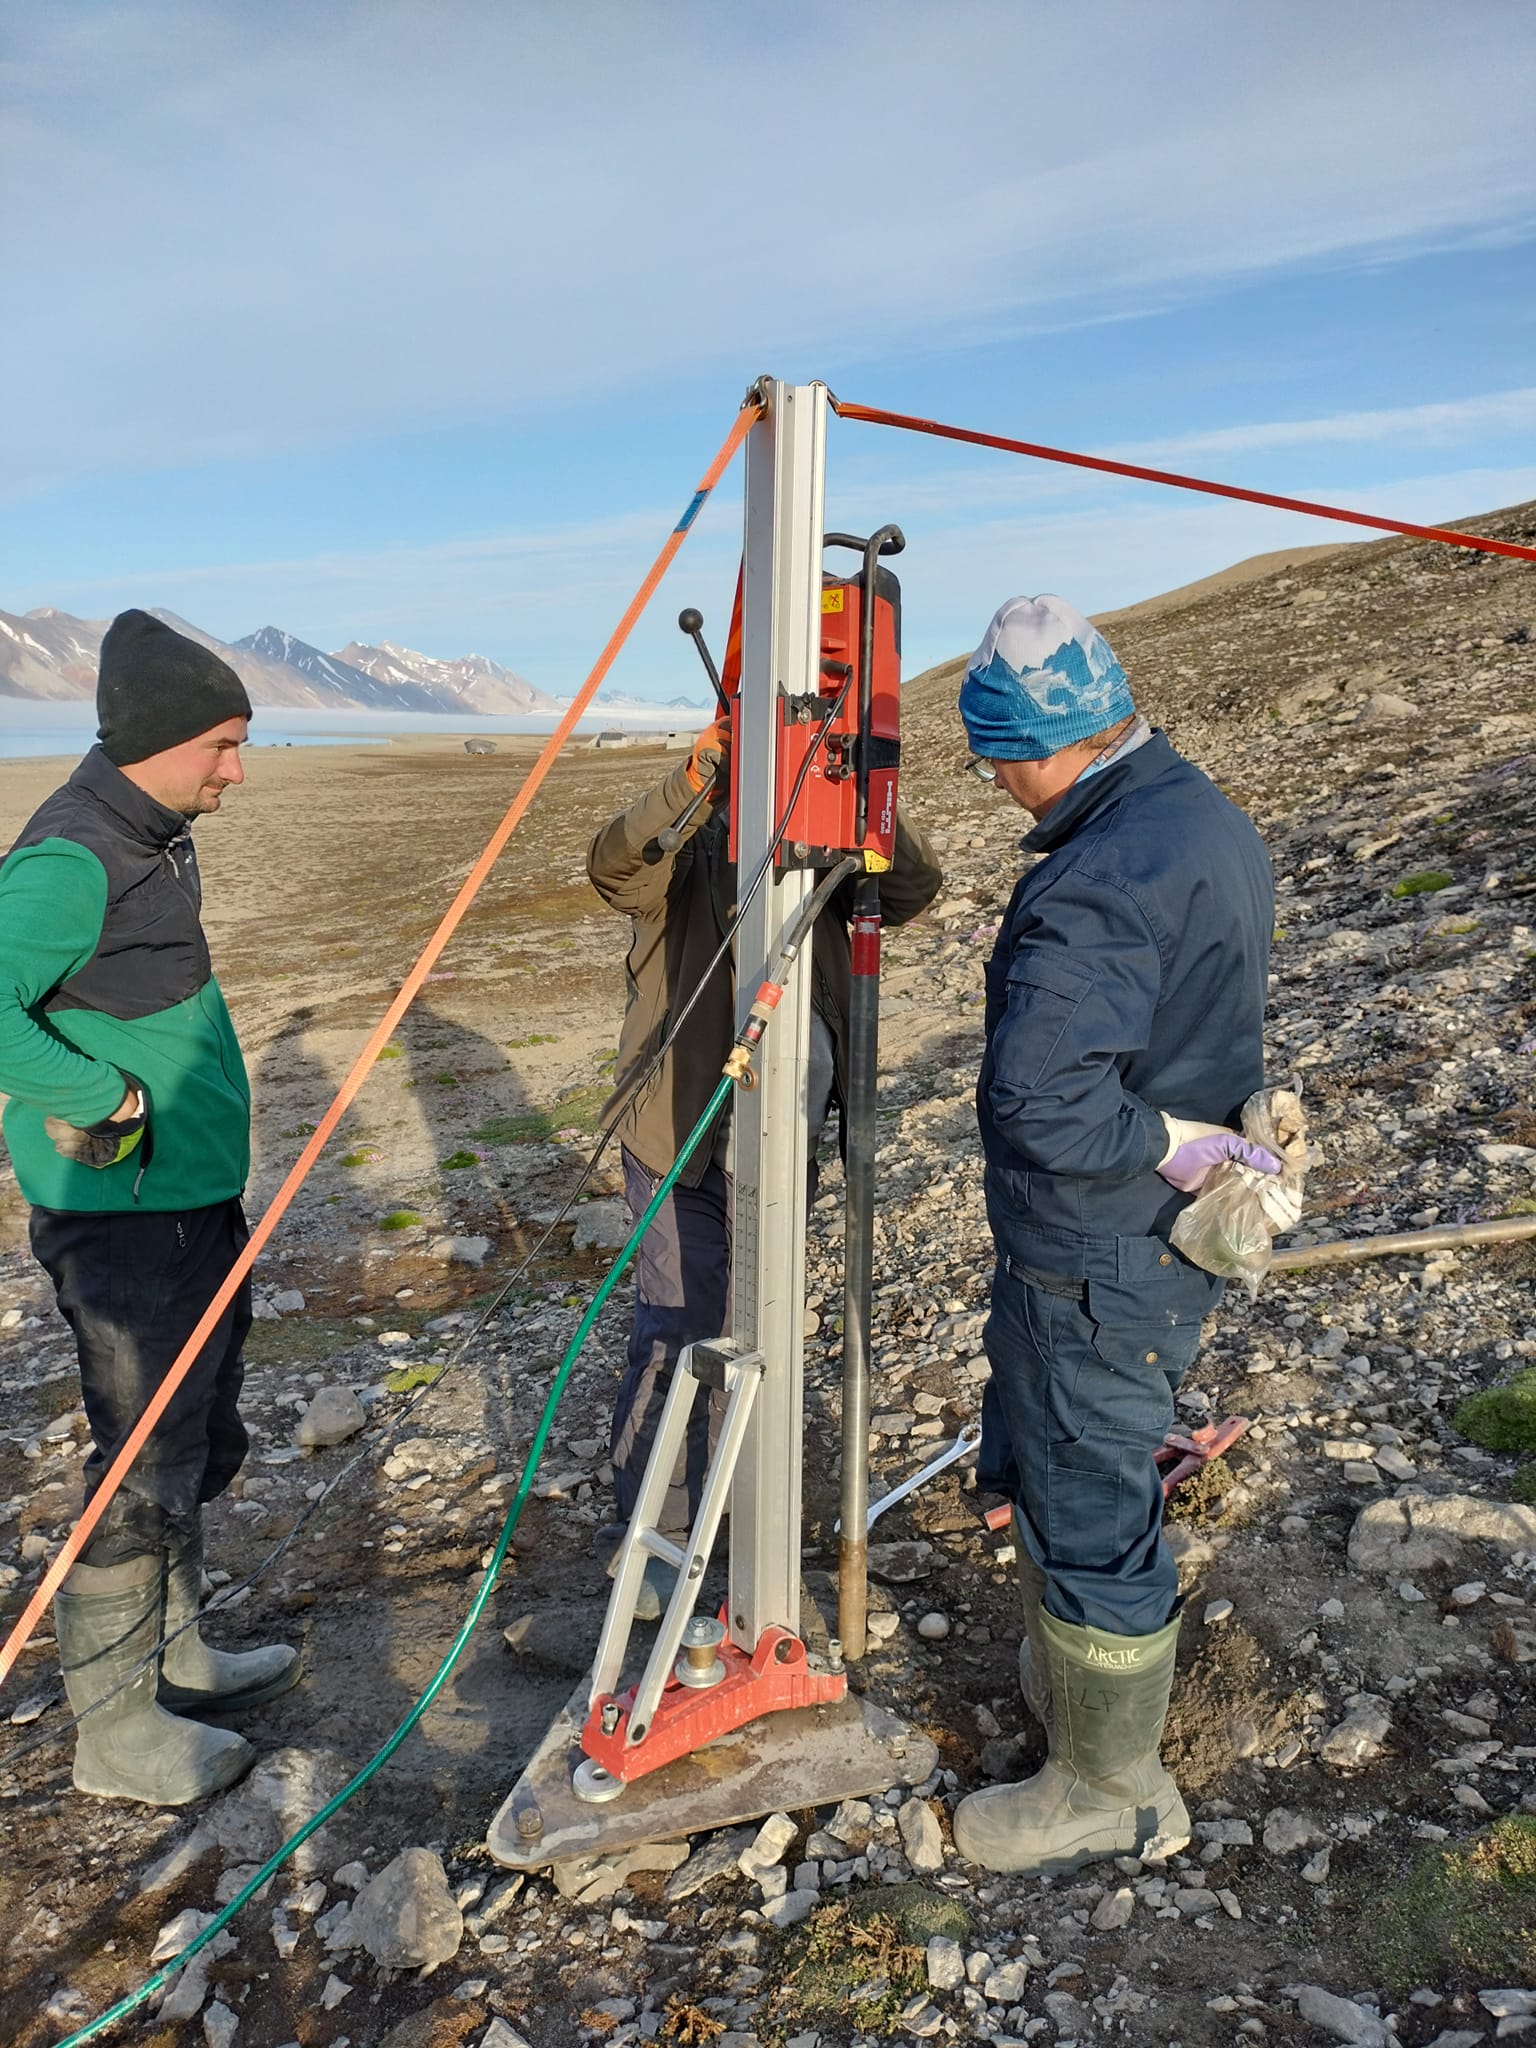
Permafrost monitoring System of thermistors (temperature strings with loggers) to monitor the ground thermal state Precise data on the thermal state of the frozen ground is one of the key missing components of the environmental monitoring at the research stations spread across Spitsbergen. The CRIOS project will allow us to equip the newly established borehole with precise temperature strings that will record ground thermal changes over the next couple of years. A system of temperature strings will be used in the monitoring of the thermal state of permafrost in drilled boreholes. Devices were tested in severe weather and are commonly used for permafrost monitoring by other research groups working in polar regions. On the coastal section selected for drilling at Calypsobyen, the bedrock contains siltstone and sandstone forming relict abrasion platforms, which are currently covered by loose sand and gravel beach sediments. The borehole was located near the mouth of the Scott River (right bank), at a distance of about 75 m from the shoreline and 900 m from the station. After stopping the drilling progress again at 5 m below sea level, a decision was made to install a string in the third hole. CRIOS – Cryosphere Integrated Observation Network on Svalbard Project financed from the EEA Financial Mechanism 2014-2021 operated by the National Science Centre in Poland Agreement no. UMO-2022/43/7/ST10/00001 to a predefined project no. 2022/43/7/ST10/00001 Project period: 08.09.2022 - 30.04.2024 (2029)
-
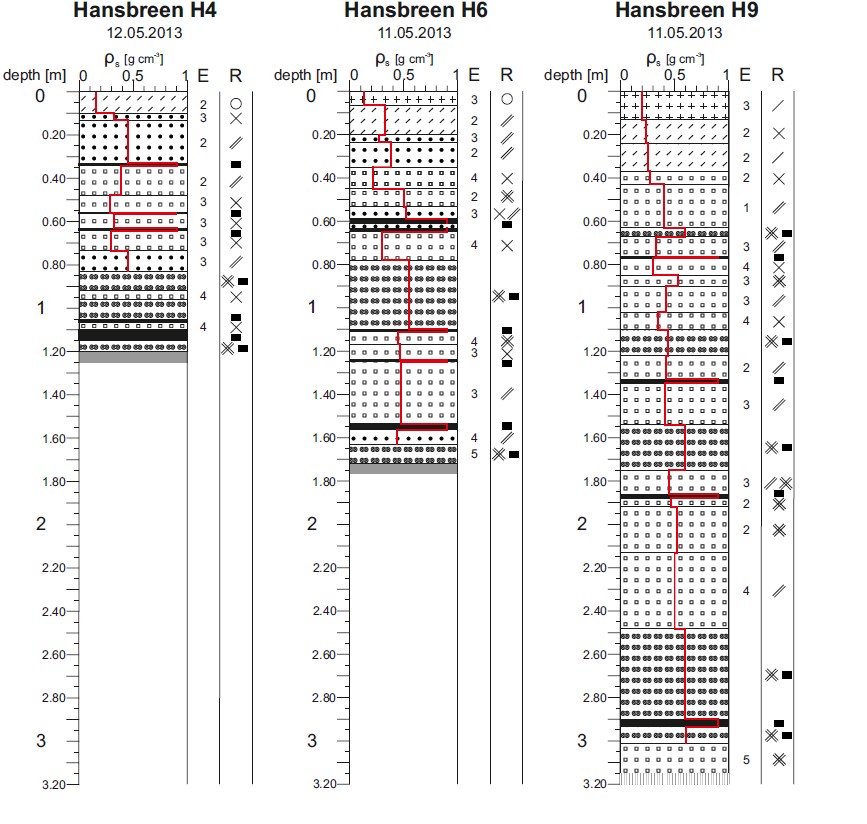
Dataset contains detailed measurements of physical features of seasonal snow cover, according to International Classification of Seasonal Snow on the Ground (Fierz et al. 2009). Fieldwork has been done during peak of accumulation on several glaciers in the region of Hornsund, Svalbard: Amundsenisen (2013) Hansbreen (three sites; 2010, 2012, 2013, 2014, 2015, 2017, 2018) Werenskioldbreen (two sites; 2013, 2015) Nannbreen (2013) Ariebreen (2014) Acknowledgements: Research Council of Norway, Arctic Field Grant 2013: Spatial distribution of snow cover and drainage systems on the glaciers on Wedel Jarlsberg Land (RiS ID: 6158); the National Science Centre PRELUDIUM 4: Role of meltwater from snow cover for supplying drainage systems of the Spitsbergen glaciers (2012/07/N/ST10/03784) References: Laska M., Luks B., Budzik T., 2016. Influence of snowpack internal structure on snow metamorphism and melting intensity on Hansbreen, Svalbard. Polish Polar Research, 37(2): 193–218. doi:10.1515/popore-2016-0012 Laska M., Grabiec M., Ignatiuk D., Budzik T., 2017. Snow deposition patterns on southern Spitsbergen glaciers, Svalbard, in relation to recent meteorological conditions and local topography. Geografiska Annaler, Series A: Physical Geography, 99(3): 262–287 doi:10.1080/04353676.2017.1327321 Laska M., Barzycka B., Luks B., 2017. Melting Characteristics of Snow Cover on Tidewater Glaciers in Hornsund Fjord, Svalbard. Water, 9(10), 804. doi:10.3390/w9100804
-
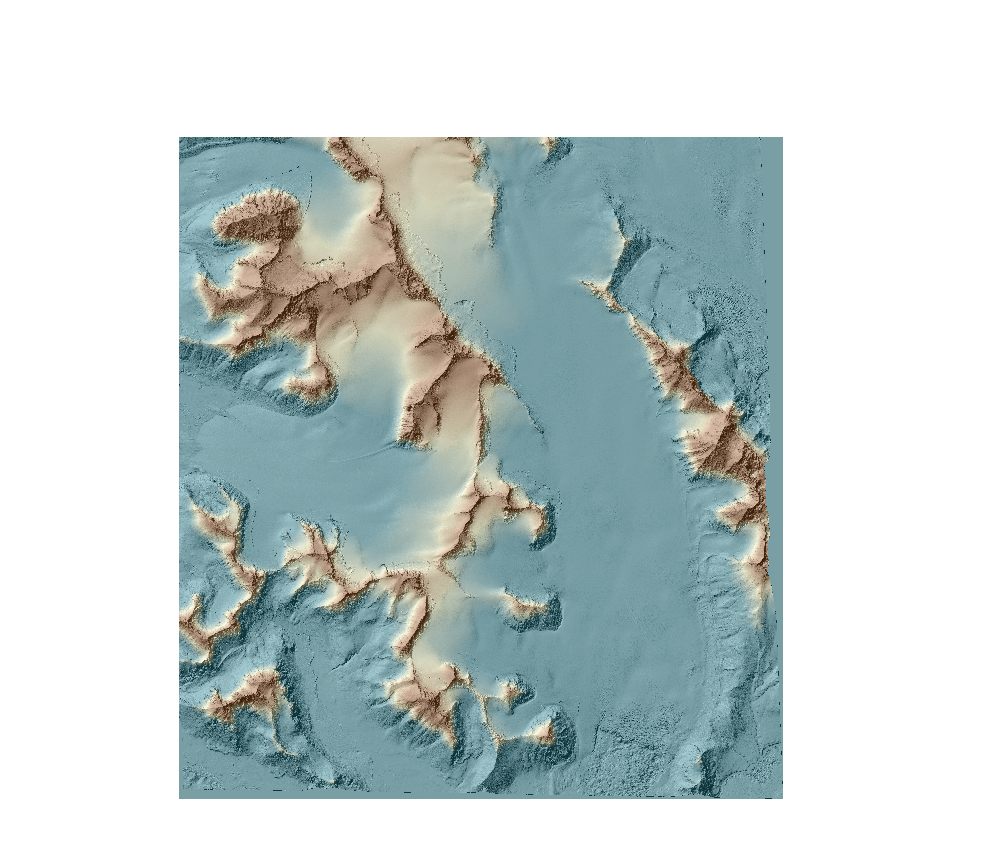
DEMs from WorldView-2 and Pléaides were extracted using the Rational Function Model (RFM). To improve images orientation, one ground control points (GCPs) was used for each stereo pair. Data format: grid (2m), UTM 33X / EGM 2008. DEMs were developed in OrthoEngine module of PCI Geomatica 2016 with the low level of detail and mountainous type of relief.
-
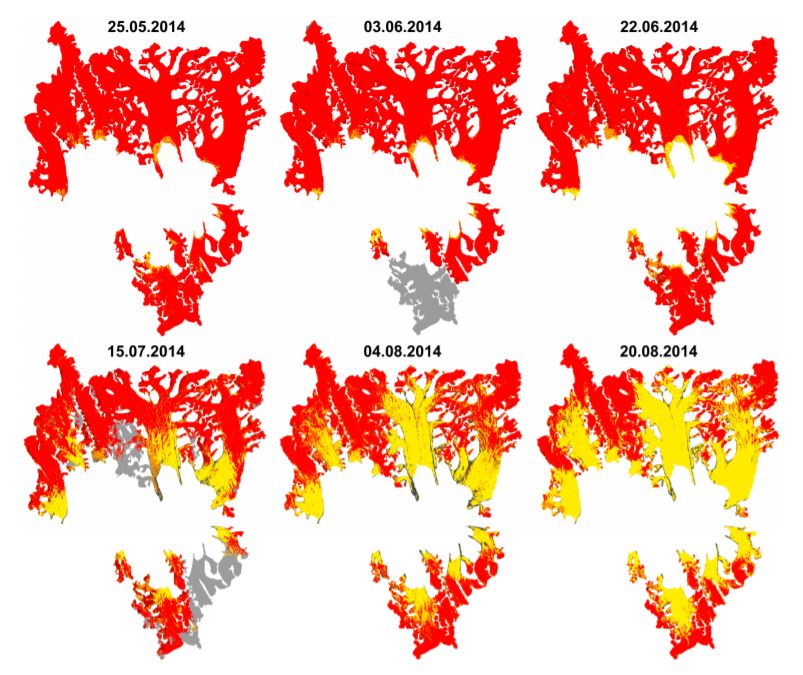
Results of supervised classification of six Landsat 8 images acquired on: 25 May, 3 June, 22 June, 15 July, 4 August and 20 August 2014, covering glaciers in Hornsund fiord. Method of classification: Maximum Likelihood. The results show variability of snow cover areas in melting period of 2014 for glaciers located in Hornsund fiord and larger than 9 km2 (Körberbreen, Samarinbreen, Chomjakovbreen, Mendelejevbreen, Svalisbreen, Hornbreen, Storbreen, Kvalfangarbreen, Mühlbacherbreen, Paierlbreen and Hansbreen). For more information, please check: https://doi.org/10.3390/w9100804 Overview: Results of Maximum Likelihood classification of Landsat 8 images for analysed glaciers. Red - snow cover, yellow - glacier ice, black - debirs, grey - cloud cover.
-
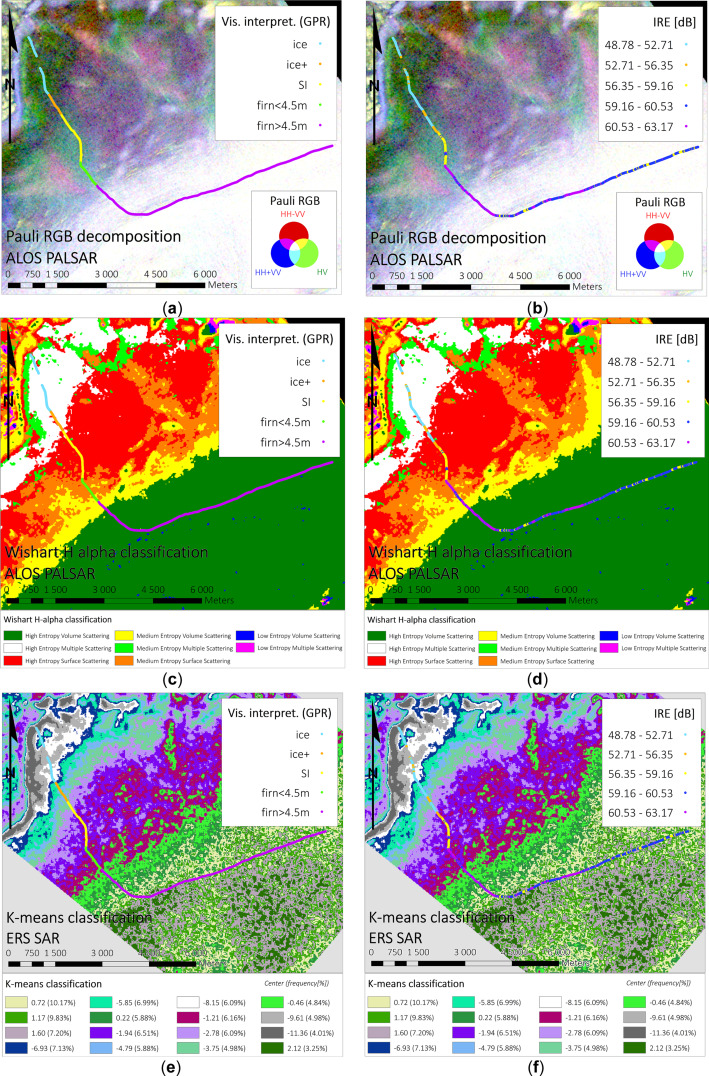
Glaciers facies extents of Vestfonna delivered from unsupervised classifications of SAR data (fully-polarimetric ALOS PALSAR, single polarimetric ERS-2 SAR) for 2009 year. Date of SAR images acquisitions: 4, 7, 20, 23, 26 May 2009 (VV Single Look Complex ERS-2 SAR), 22 May 2009 (ALOS PALSAR Single Look Complex 1.1, quad polarimetry). Method of classification: K-means classification, H-a Wishart Classification. Results validated with Ground Penetrating Radar data. For more information, please check: https://doi.org/10.1016/j.rse.2018.11.020 Overwiew of results of different classification methods with comparison to GPR data. Top panel: Pauli decomposition, middle panel: H-a Wishart classification, bottom panel: k-means classification. For more information, please check: https://doi.org/10.1016/j.rse.2018.11.020 (Figure 7).
-

1. Dataset of UAV vertical aerial photos of front and ice melange in the north part of Tunabreen, obtained in spring 2017. Area covered: ~1600x~800m. Used UAV: Phantom 3 Advanced, flight height: 100m. Data obtained during fieldwork supported by Svalbard Science Forum, Arctic Field Grant 2017 with cooperation with University of Maine (USA) and the University Centre in Svalbard (Norway).
-
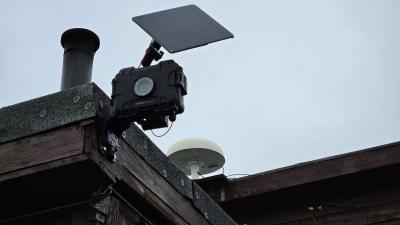
Time-lapse cameras In order to determine the state of coverage of the area, e.g. period of snow cover on a tundra, the extent of the glacier front, etc., it is necessary to perform photographic imaging at a specific time interval. This will allow for precise diagnosis of snow conditions. The camera is installed at the main entrance to the NCU Polar Station. The lens is pointed in a westerly direction, towards Prins Karls Forland CRIOS – Cryosphere Integrated Observation Network on Svalbard Project financed from the EEA Financial Mechanism 2014-2021 operated by the National Science Centre in Poland Agreement no. UMO-2022/43/7/ST10/00001 to a predefined project no. 2022/43/7/ST10/00001 Project period: 08.09.2022 - 30.04.2024 (2029)
-
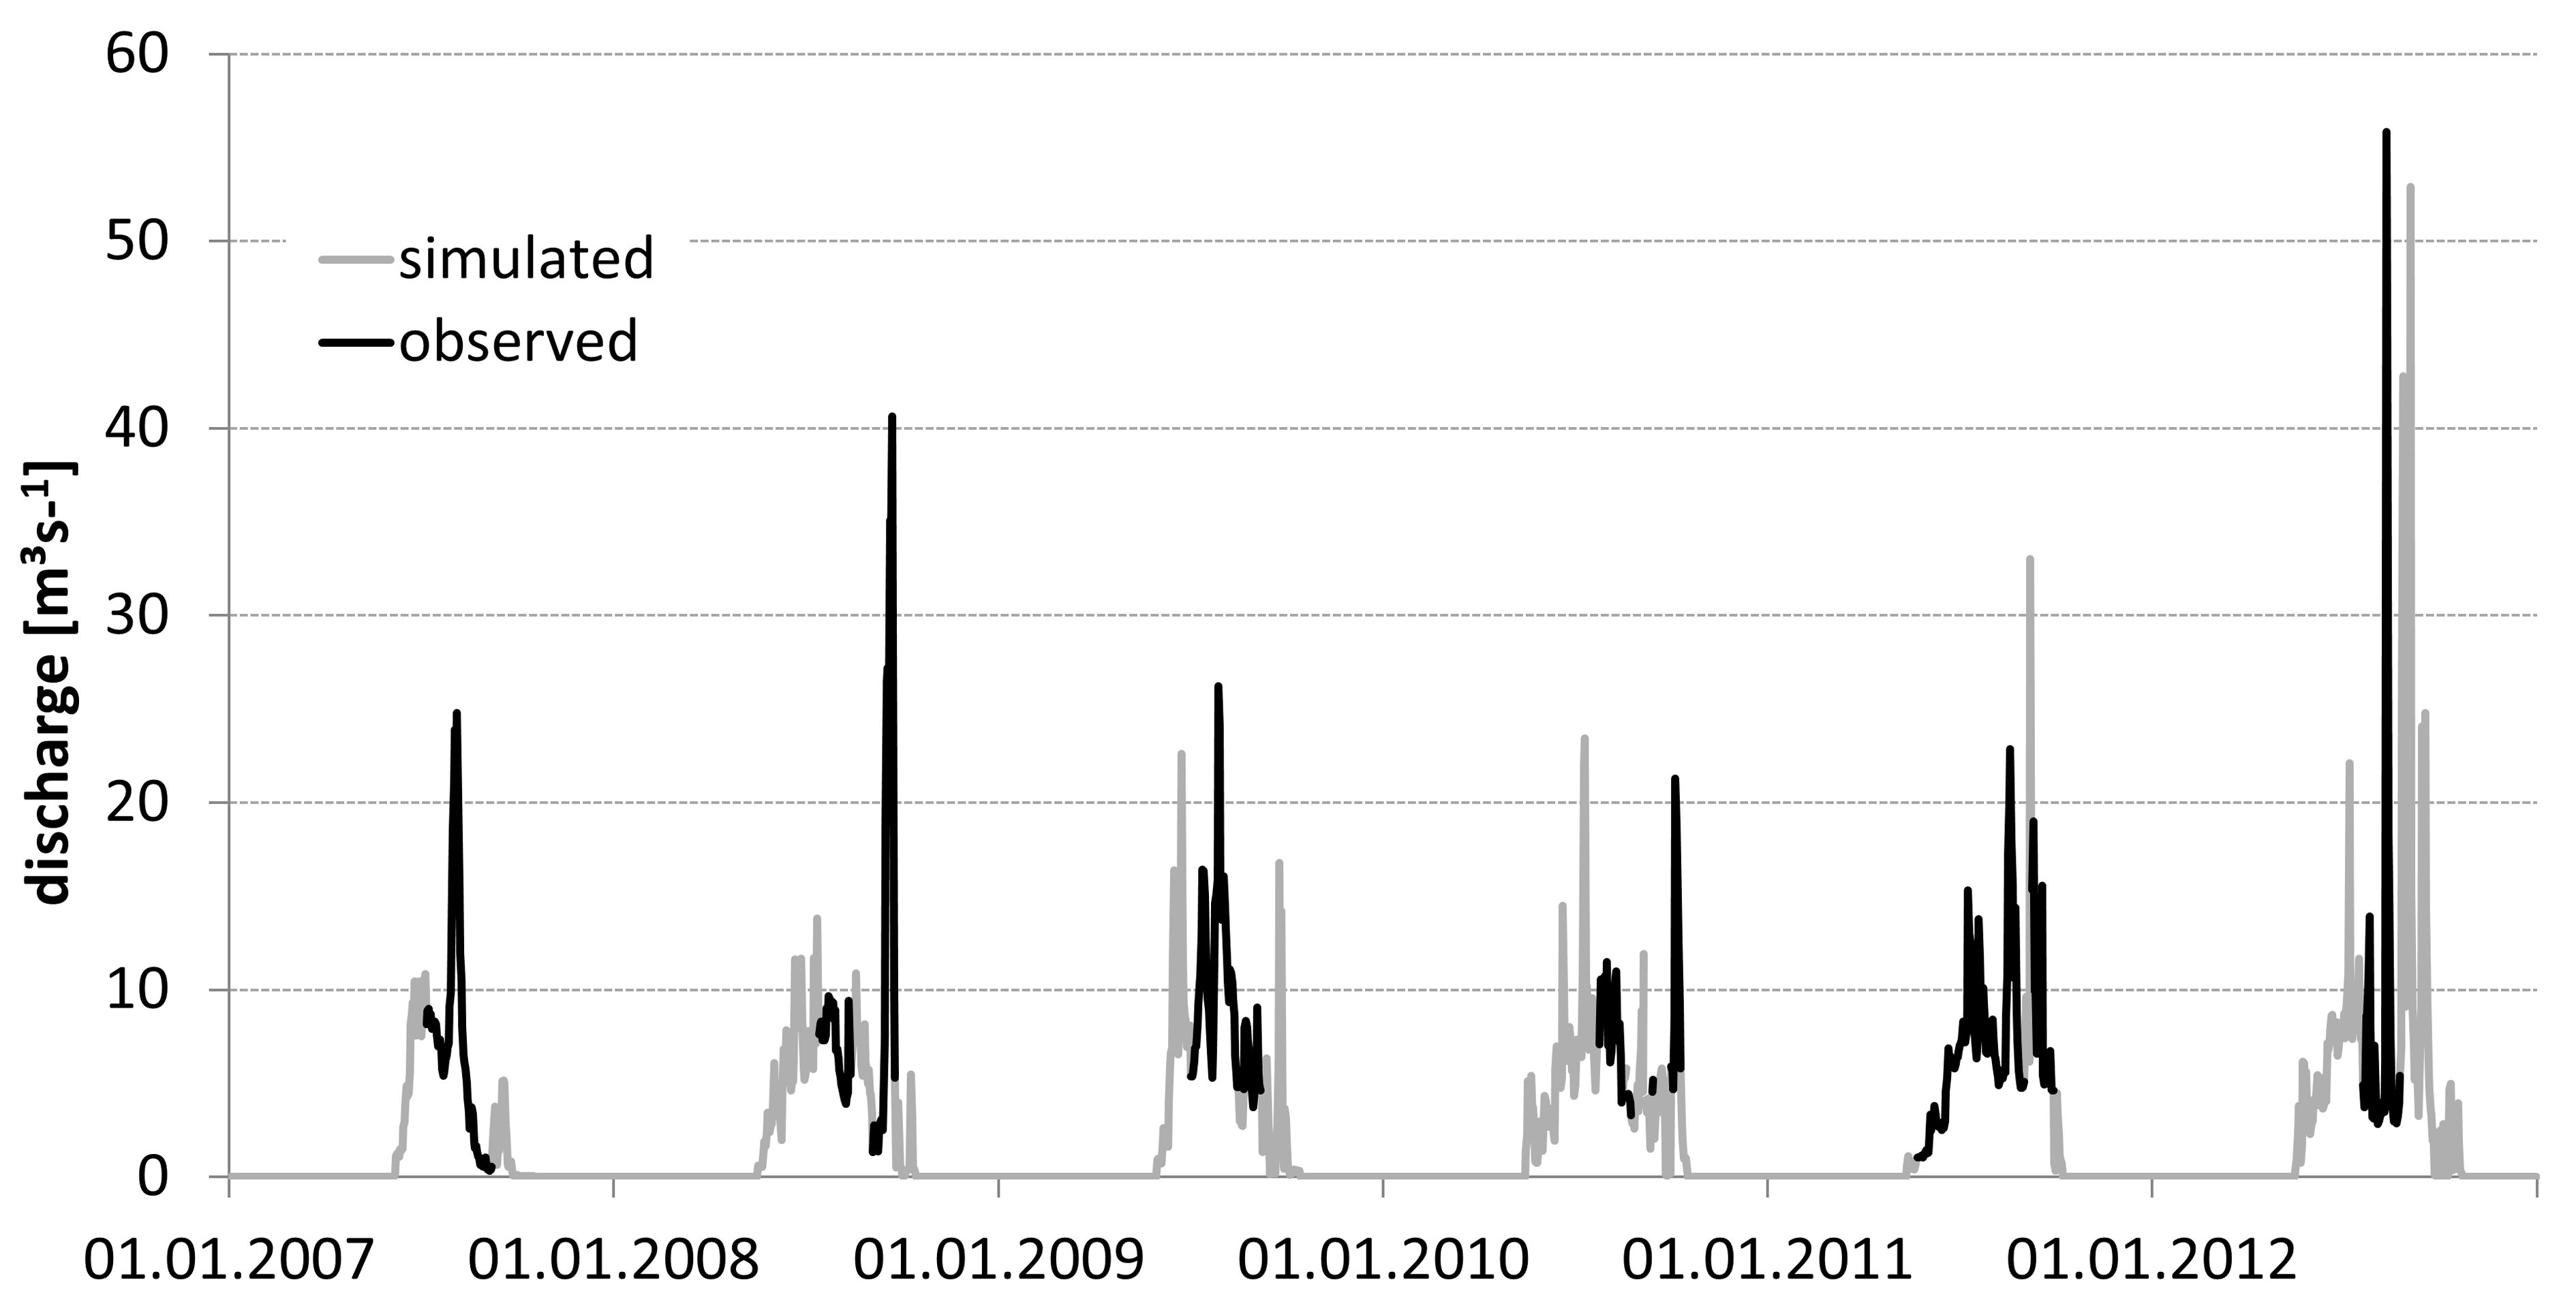
• Discharge measurements were conducted from May/June/July to September/October in the years 2007–2012. Direct observation periods were 62, 51, 61, 40, 121, and 35 days in the consecutive years. The data set was obtained from CTD-DIVER DI 261 or Mini-Diver (Van Essen Instruments, Delft, The Netherlands) logger with barometric compensation by BaroDiver (Schlumberger, Houston, TX, USA) with 10-min intervals and flow velocities were measured with a SEBA F1 current meter (SEBA Hydrometrie GmbH, Kaufbeuren, Germany). Mean daily discharge and total runoff in the hydrologically active season was calculated on the basis of the 24h running average of the water level and a rating curve (Appendix 1). More details have been reported by Majchrowska E., Ignatiuk D., Jania J., Marszałek H., Wąsik M., 2015: Seasonal and interannual variability in runoff from the Werenskioldbreen catchment, Spitsbergen. Polish Polar Research vol. 36, no. 3, pp. 197–224. doi: 10.1515/popore−2015−0014 • Hydrological data for Werenskioldbreen - archive of the University of Silesia. The base contain mean daily discharge in the years: 1972, 1973, 1974, 1979, 1980, 1983, 1985, 1986, 1988, 1998, 2007, 2008, 2009, 2010, 2011, 2012, 2013, 2017 (18 hydrologically active seasons) – Appendix 2
-
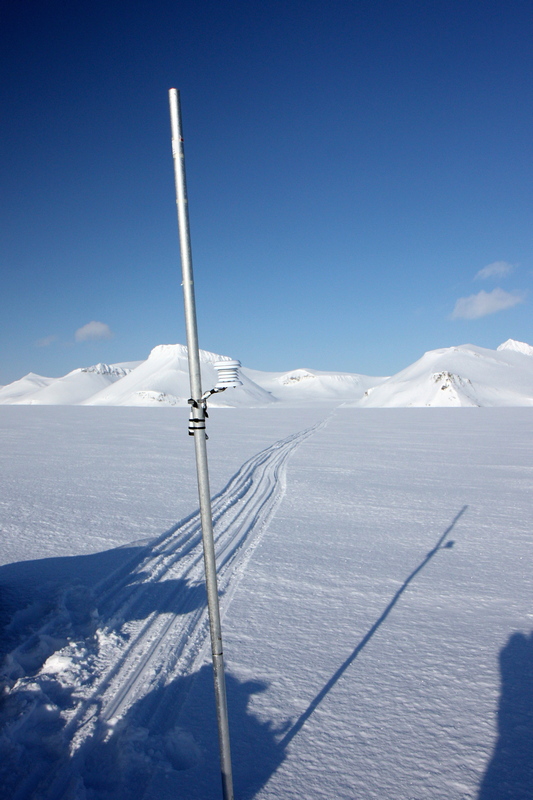
Meteorological data from Flat Glacier (Flatbreen) - air temperature.
-
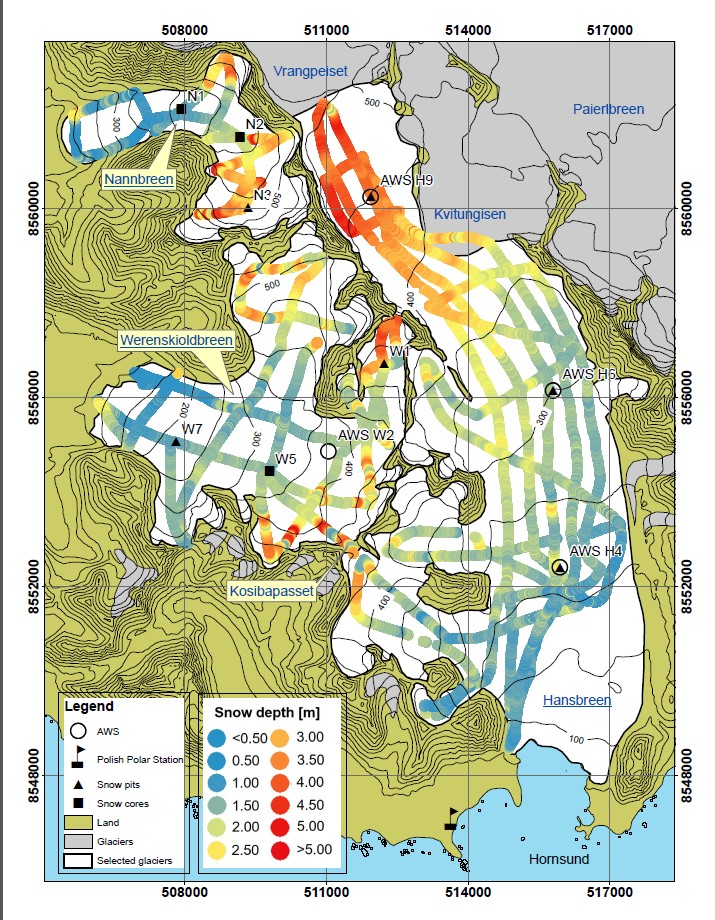
Dataset contains results of GPR survey performed with 800 MHz antennas for snow depth calculation. Fieldwork has been done during peak of accumulation, along repeated profiles on several glaciers in the region of Hornsund, Svalbard: Amundsenisen (2013) Werenskioldbreen (2013, 2014, 2015) Nannbreen (2013) Ariebreen (2014) Flatbreen (2018) Storbreen (2018) Acknowledgements: Research Council of Norway, Arctic Field Grant 2013: Spatial distribution of snow cover and drainage systems on the glaciers on Wedel Jarlsberg Land (RiS ID: 6158); the National Science Centre PRELUDIUM 4: Role of meltwater from snow cover for supplying drainage systems of the Spitsbergen glaciers (2012/07/N/ST10/03784); References: LASKA M.,GRABIEC M.,IGNATIUK D.,BUDZIK T.,2017. Snow deposition patterns on southern Spitsbergen glaciers, Svalbard, in relation to recent meteorological conditions and local topography. Geografiska Annaler, Series A: Physical Geography, 99(3): 262–287. doi:10.1080/04353676.2017.1327321