dataset
Type of resources
Available actions
Topics
Keywords
Contact for the resource
Provided by
Years
Formats
Representation types
Update frequencies
status
Scale
-
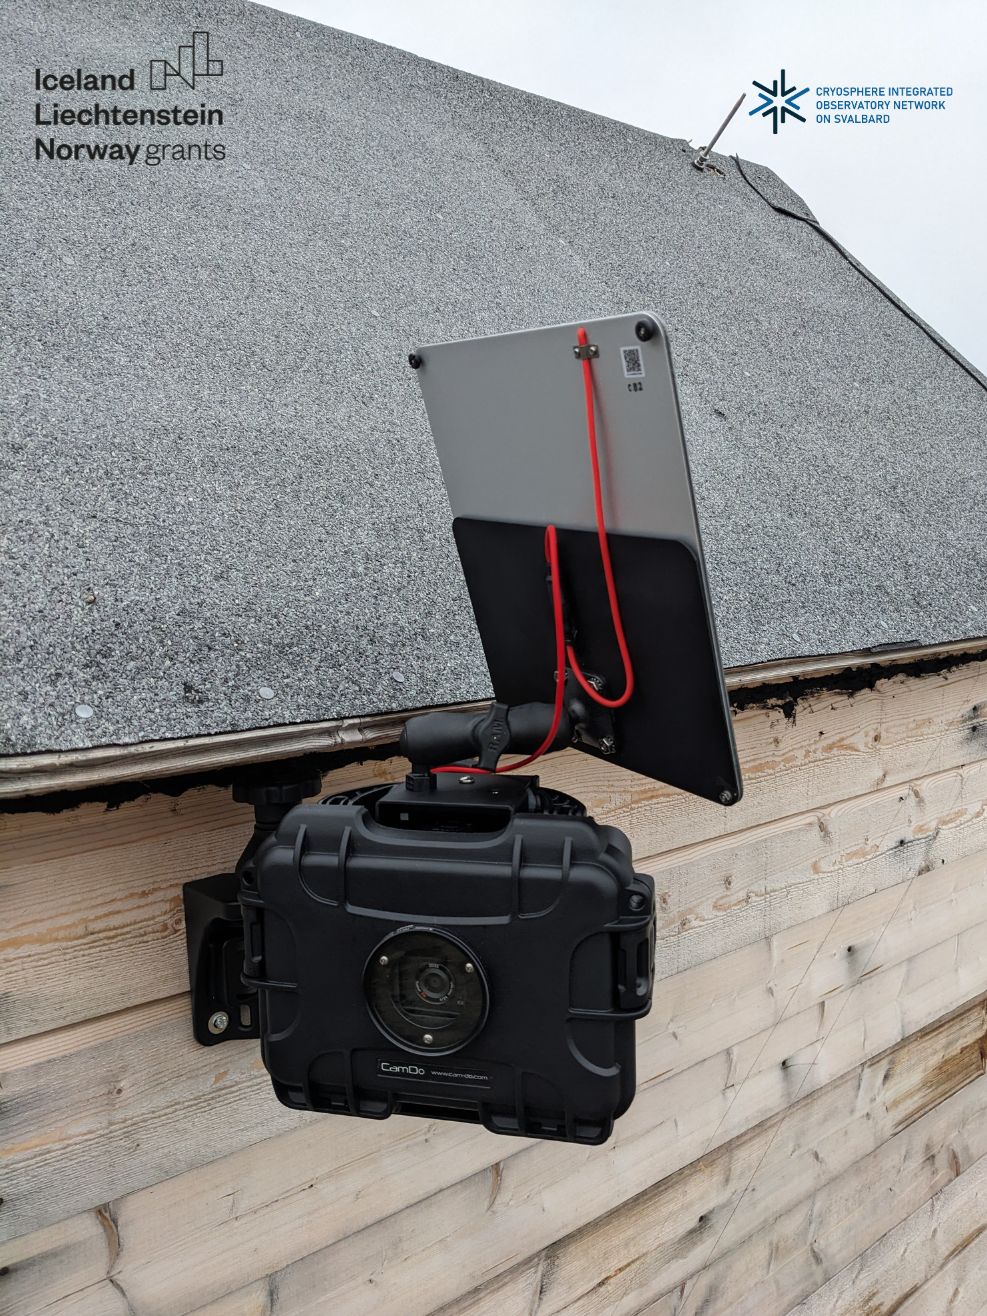
Time-lapse cameras In order to determine the state of coverage of the area, e.g. period of snow cover on a tundra, the extent of the glacier front, etc., it is necessary to perform photographic imaging at a specific time interval. This will allow for precise diagnosis of snow conditions. CRIOS – Cryosphere Integrated Observation Network on Svalbard Project financed from the EEA Financial Mechanism 2014-2021 operated by the National Science Centre in Poland Agreement no. UMO-2022/43/7/ST10/00001 to a predefined project no. 2022/43/7/ST10/00001 Project period: 08.09.2022 - 30.04.2024 (2029)
-
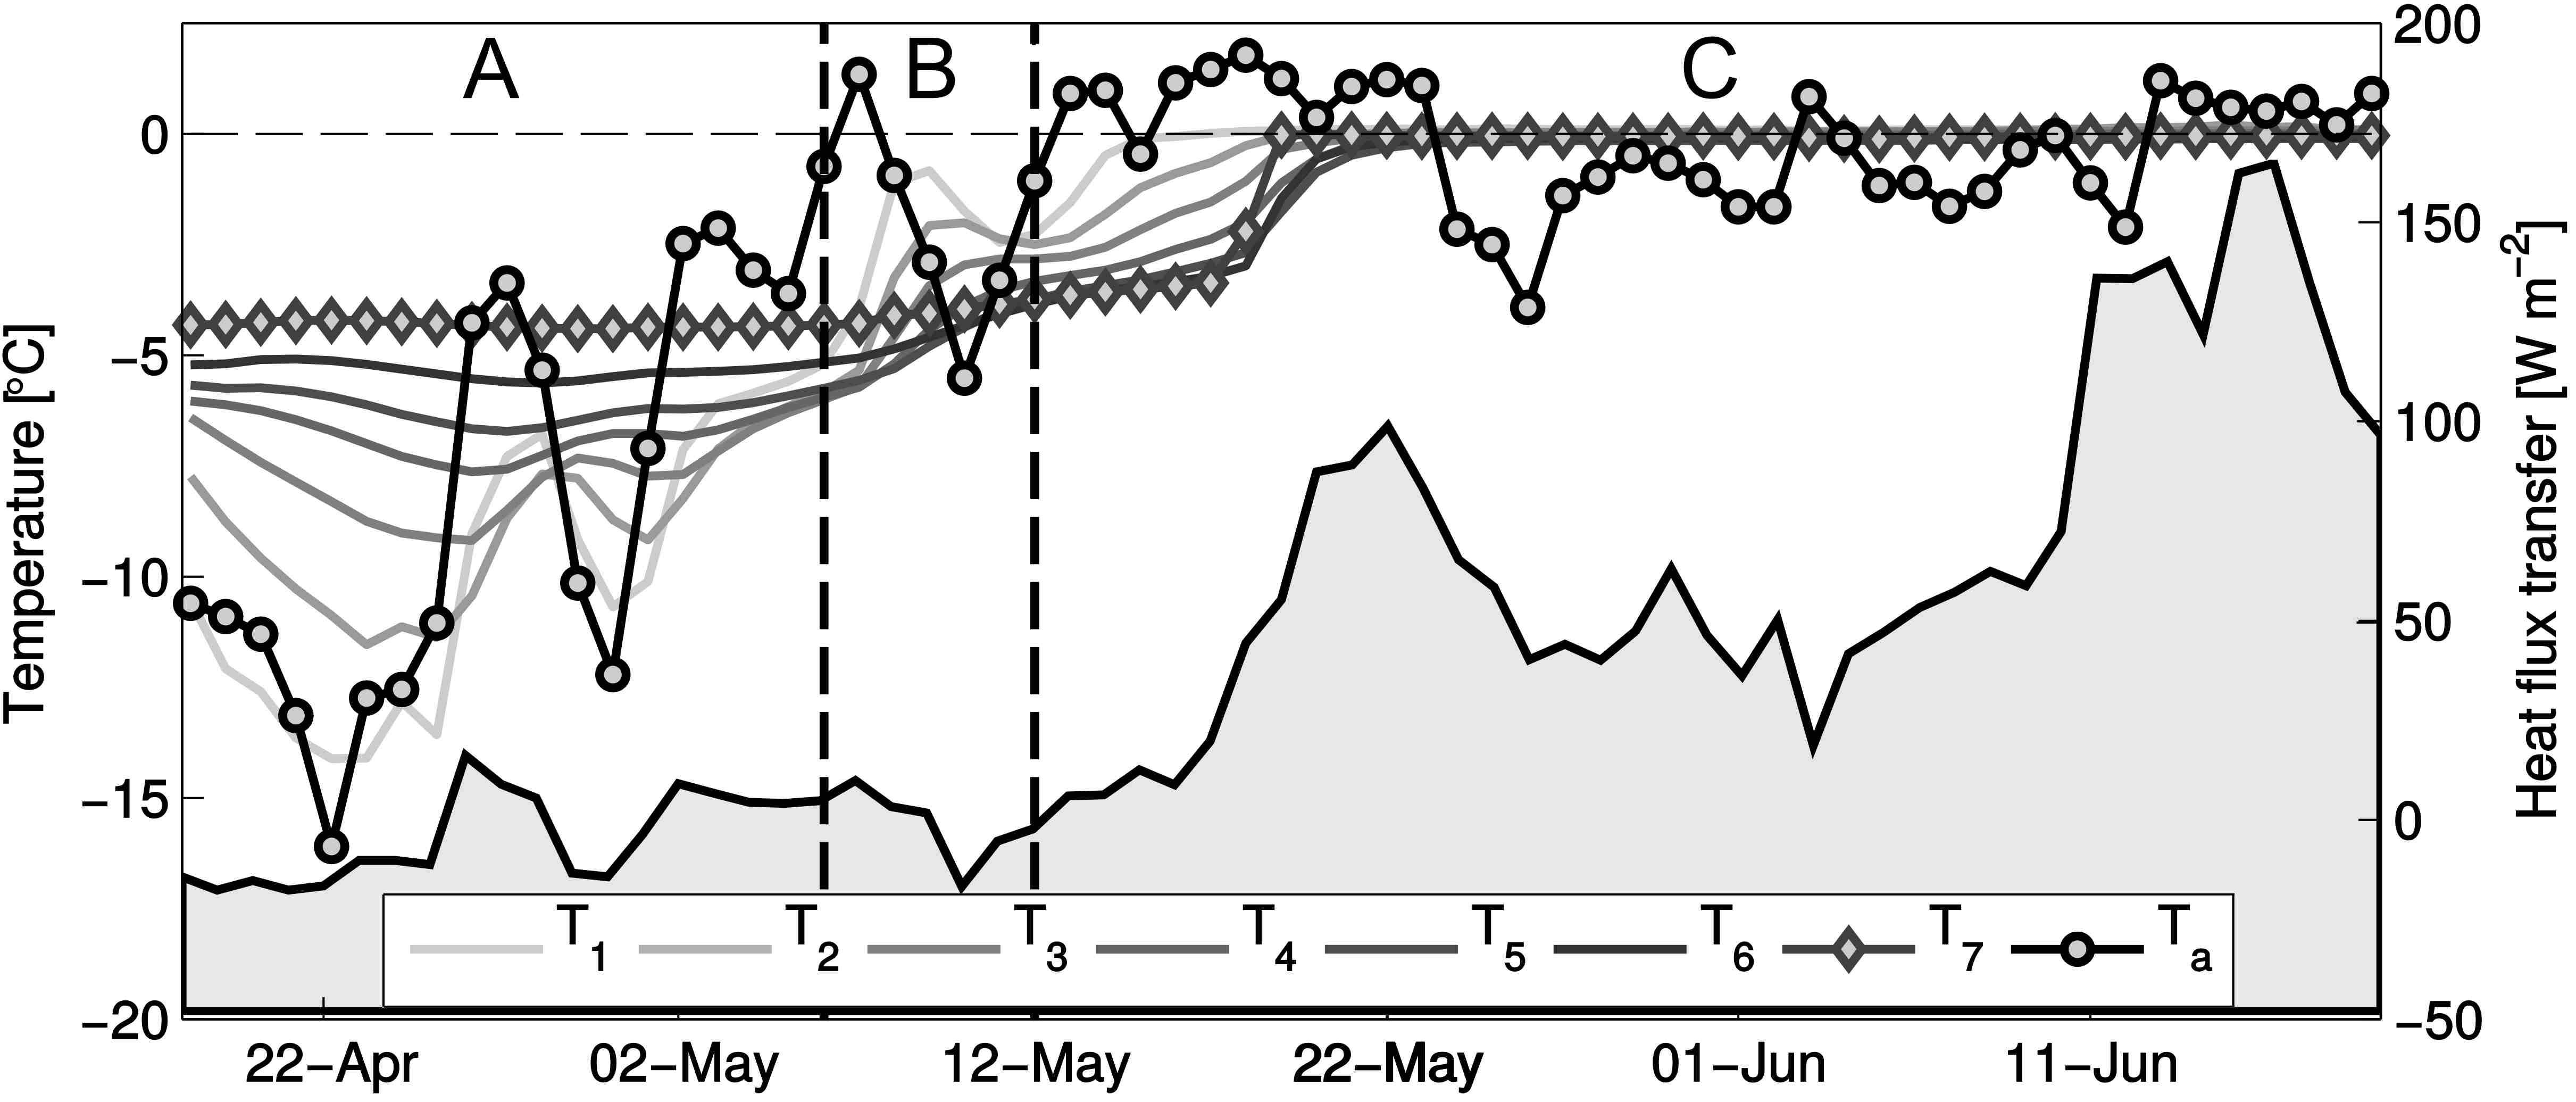
Dataset contains evolution of the snow temperature within seasonal snowpack on Hansbreen. Fieldwork has been performed with several thermistors located at different levels (from snow surface to the bottom, on glacier ice) from April to July 2010 (during period of early and intensive surface melting). Study has been repeated in 2015, at the same location. Acknowledgements: Research Council of Norway, Arctic Field Grant 2013: Spatial distribution of snow cover and drainage systems on the glaciers on Wedel Jarlsberg Land (RiS ID: 6158); the National Science Centre PRELUDIUM 4: Role of meltwater from snow cover for supplying drainage systems of the Spitsbergen glaciers (2012/07/N/ST10/03784) References: Laska M., Luks B., Budzik T., 2016. Influence of snowpack internal structure on snow metamorphism and melting intensity on Hansbreen, Svalbard. Polish Polar Research, 37(2): 193–218. doi:10.1515/popore-2016-0012
-
Time-lapse cameras In order to determine the state of coverage of the area, e.g. period of snow cover on a tundra, the extent of the glacier front, etc., it is necessary to perform photographic imaging at a specific time interval. This will allow for precise diagnosis of snow conditions. The camera is installed at the main entrance to the NCU Polar Station. The lens is pointed in a westerly direction, towards Prins Karls Forland CRIOS – Cryosphere Integrated Observation Network on Svalbard Project financed from the EEA Financial Mechanism 2014-2021 operated by the National Science Centre in Poland Agreement no. UMO-2022/43/7/ST10/00001 to a predefined project no. 2022/43/7/ST10/00001 Project period: 08.09.2022 - 30.04.2024 (2029)
-
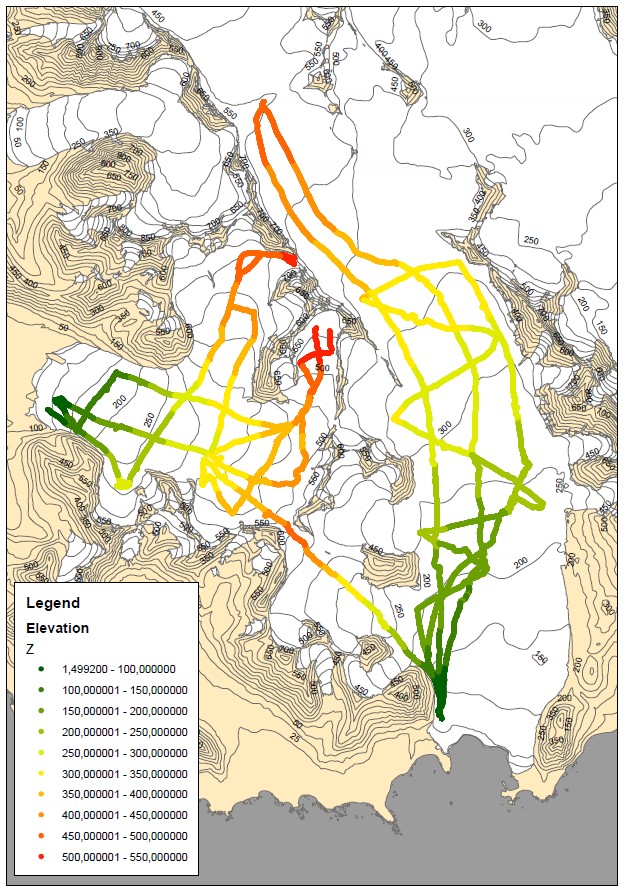
Dataset contains surface elevation along spring GPR profiles performed on Hansbreen and Werenskioldbreen. Fieldwork has been done with dGPS device in kinematic mode at the end of ablation season in 2013 and 2015 to compare it with spring GPR survey and calculate surface ablation. Acknowledgements: Research Council of Norway, Arctic Field Grant 2013: Spatial distribution of snow cover and drainage systems on the glaciers on Wedel Jarlsberg Land (RiS ID: 6158); the National Science Centre PRELUDIUM 4: Role of meltwater from snow cover for supplying drainage systems of the Spitsbergen glaciers (2012/07/N/ST10/03784)
-
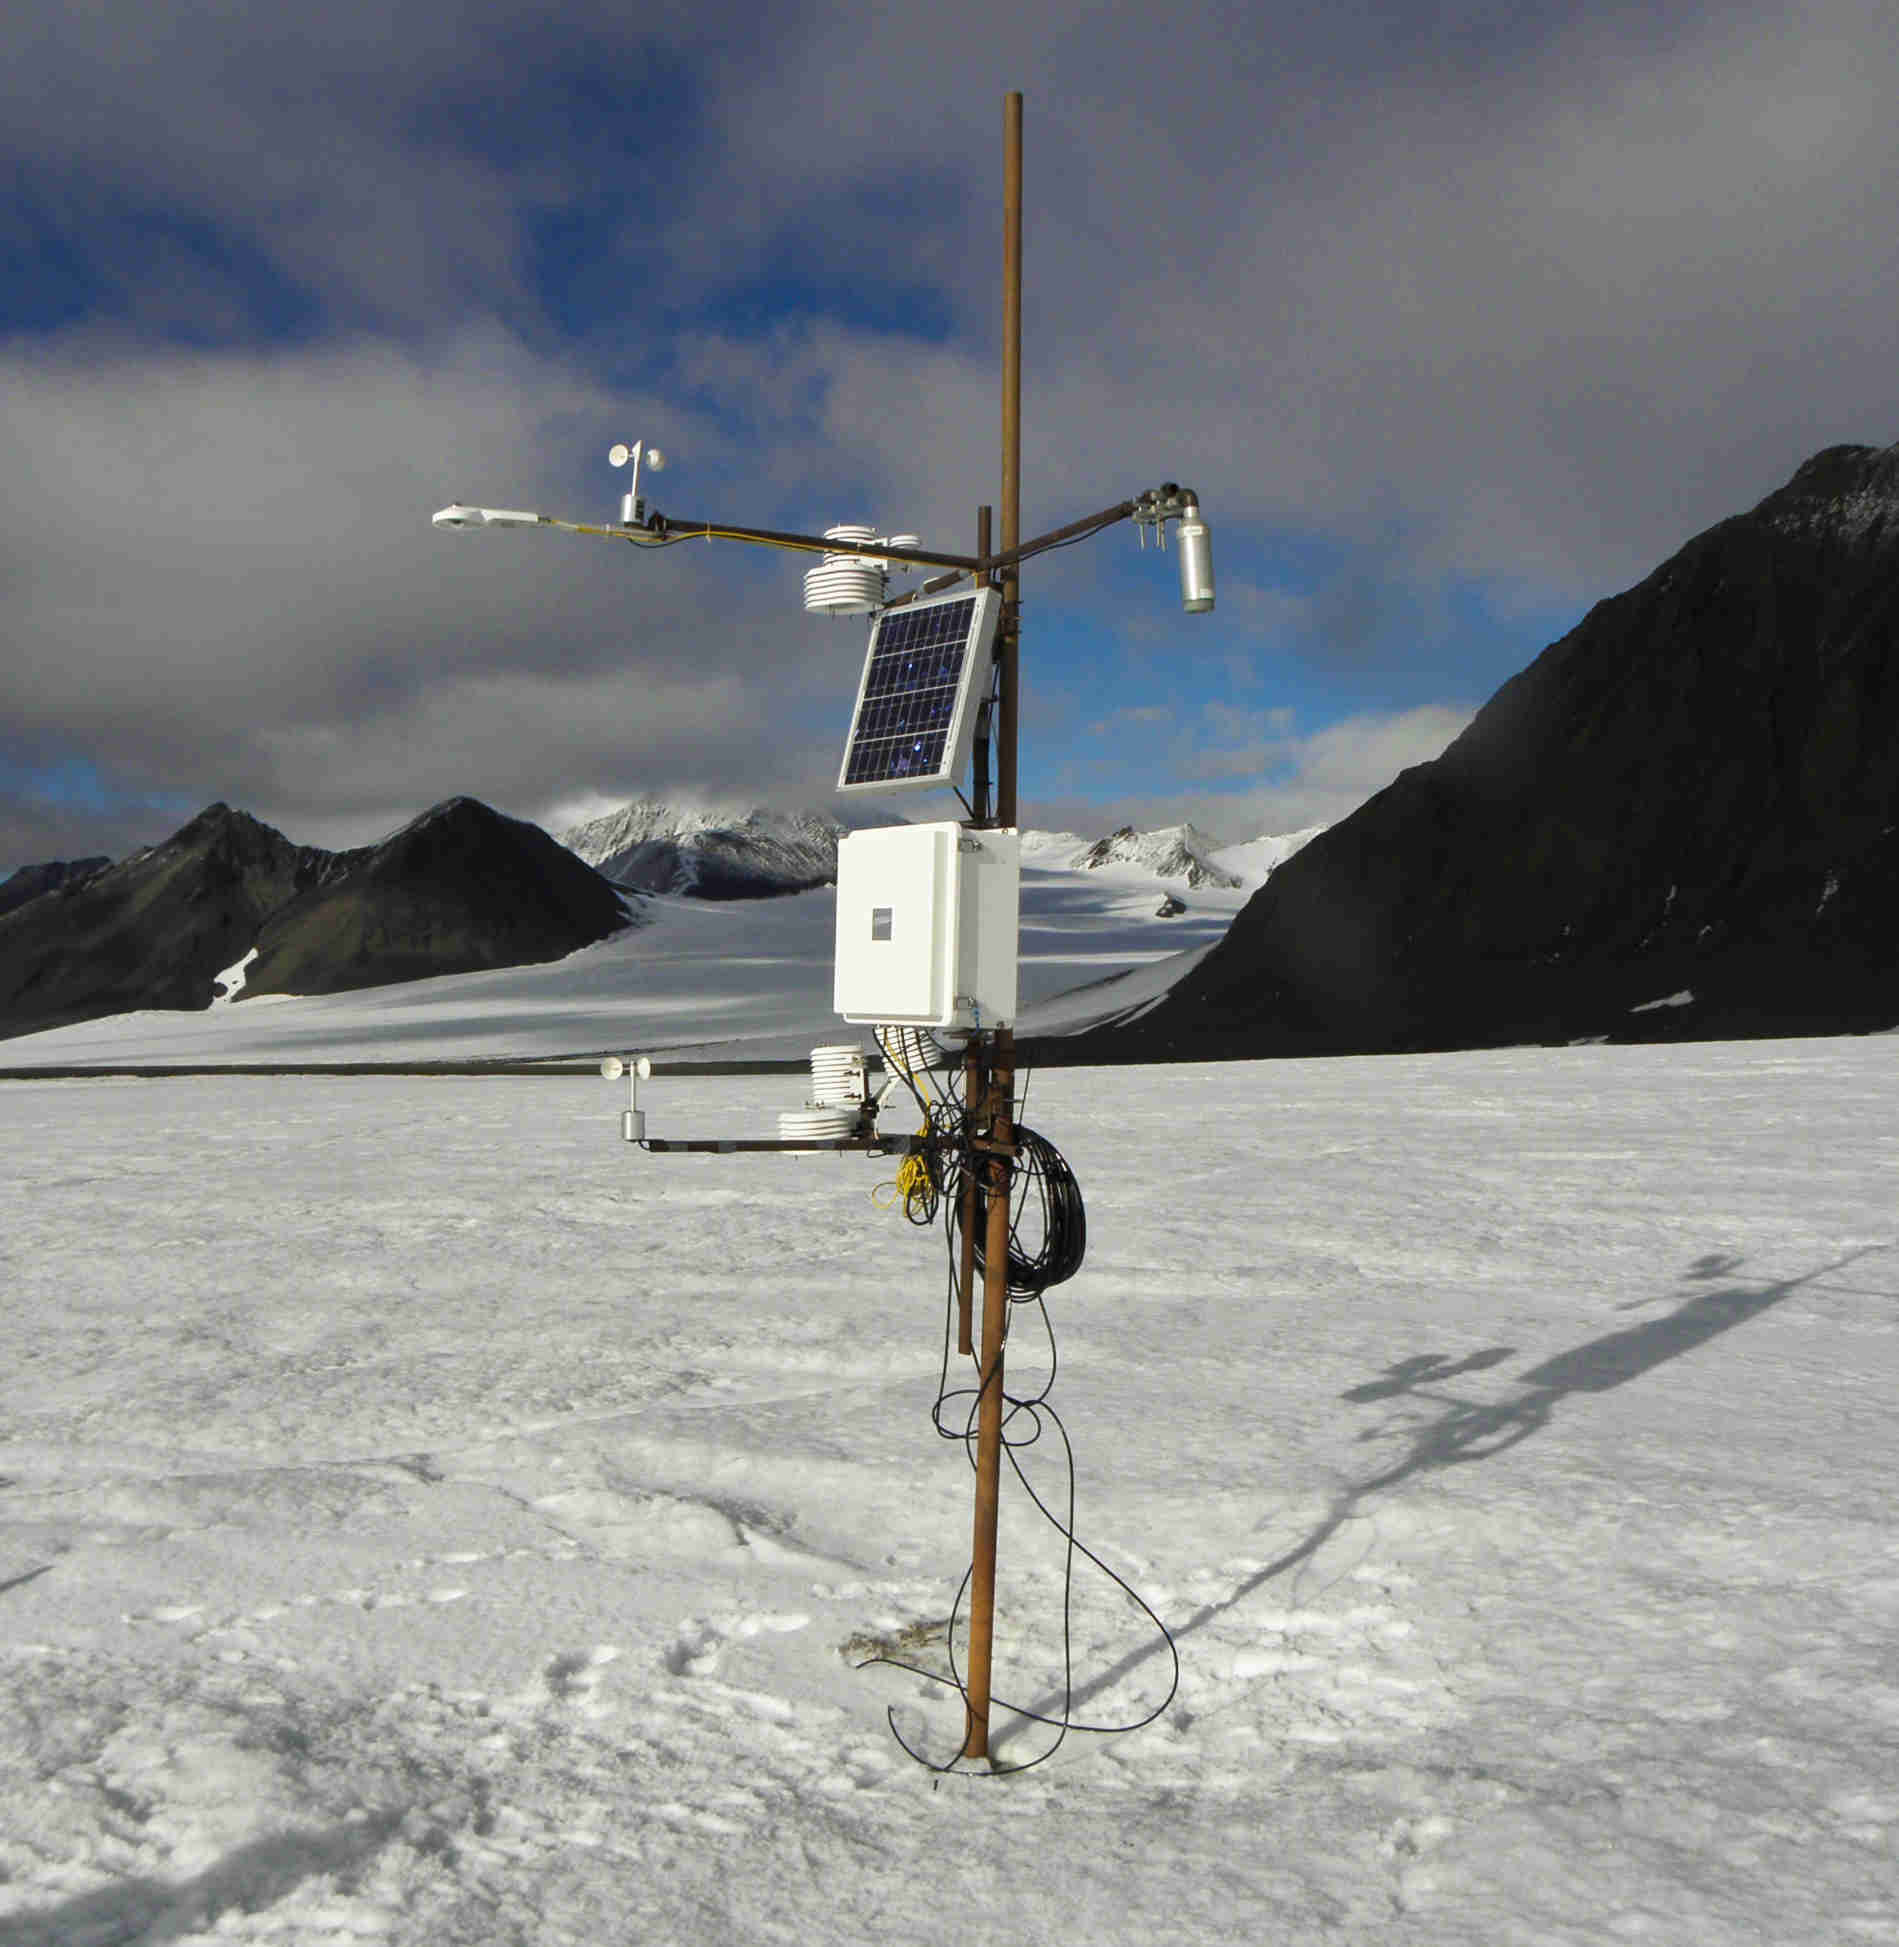
Upwelling shortwave flux in air measurements from AWS located on the Werenskioldbreen. The sensors are installed on a mast that is mounted in the glacier ice. During the season, the distance between the glacier's surface and the sensors increases. The station is serviced at least once a year between March and April.
-
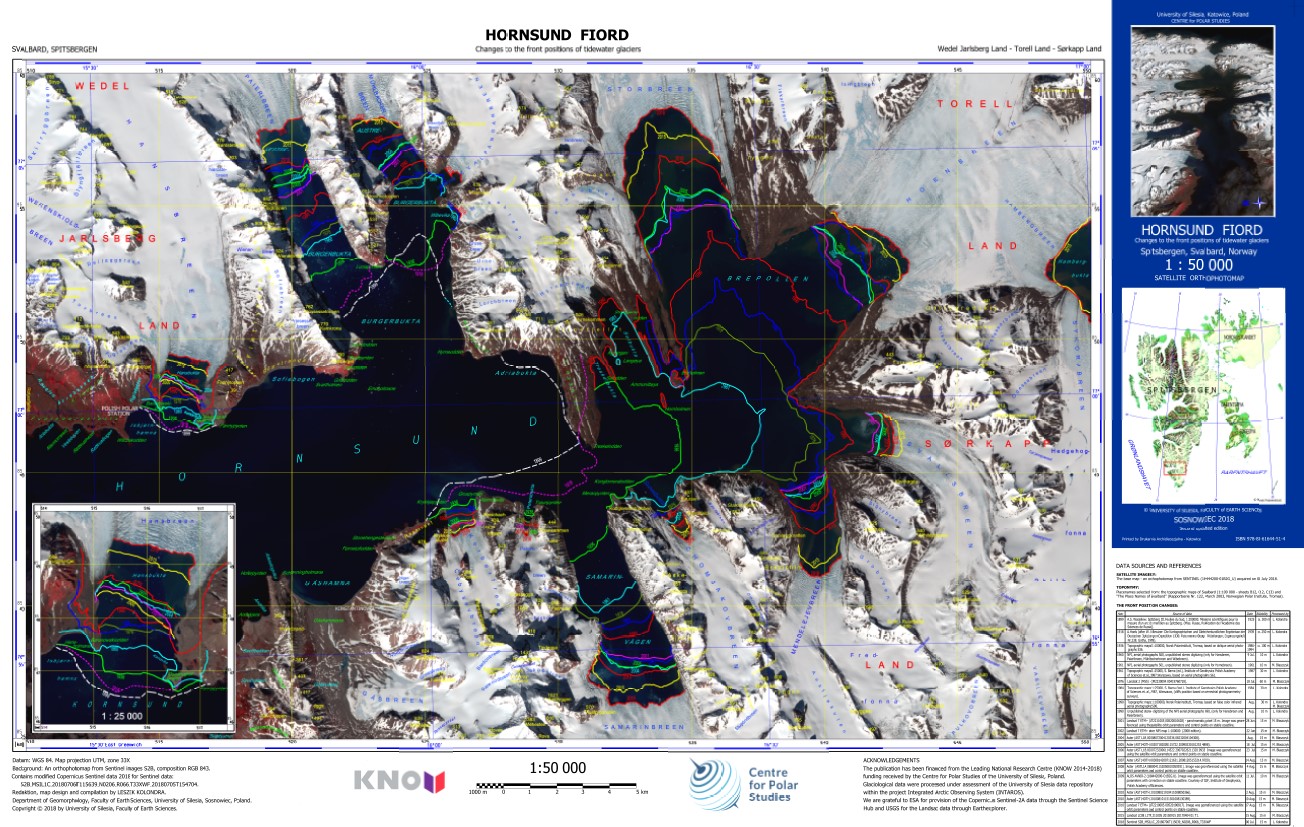
The ortophotomap of Hornsund Fiord with changes to the front positions of tidewater glaciers. The front positions are based on different cartographical maps and satellite data. The base map is Sentinel 2 satellite image acquired on 6 July 2018. Citation: Kolondra L., 2018. Hornsund Fiord - Changes to the front positions of tidewater glaciers. University of Silesia, Faculty of Earth Sciences.
-
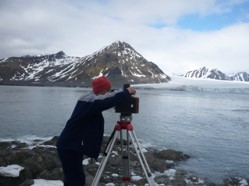
Average terminus height above sea level for the period 1992–1996, 2000 and 2010 was acquired with an accuracy of ±1.5 m, using terrestrial photogrammetry. The glacier terminus height in September 2009 and 2015 was measured using precise laser scanning with an accuracy of ±0.5 m. The height data obtained using photogrammetry and a laser scanner are averaged along the ice face. The database is the supplement to the paper: Małgorzata Błaszczyk, Jacek A. Jania, Michał Ciepły, Mariusz Grabiec, Dariusz Ignatiuk, Leszek Kolondra, Aleksandra Kruss, Bartłomiej Luks, Mateusz Moskalik, Tadeusz Pastusiak, Agnieszka Strzelewicz, Waldemar Walczowski, Tomasz Wawrzyniak. “Factors controlling terminus position of Hansbreen, a tidewater glacier in Svalbard”, Journal of Geophysical Research - Earth Surface, https://doi.org/10.1029/2020JF005763.
-
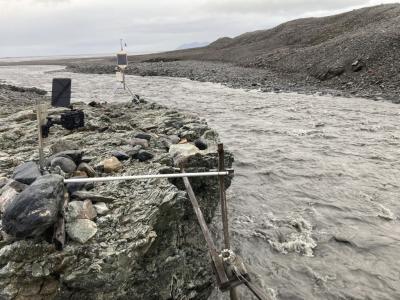
Time-lapse cameras In order to determine the state of coverage of the area, e.g. period of snow cover on a tundra, the extent of the glacier front, etc., it is necessary to perform photographic imaging at a specific time interval. This will allow for precise diagnosis of snow conditions. The camera is installed in the glacier catchment area at the hydrological station. CRIOS – Cryosphere Integrated Observation Network on Svalbard Project financed from the EEA Financial Mechanism 2014-2021 operated by the National Science Centre in Poland Agreement no. UMO-2022/43/7/ST10/00001 to a predefined project no. 2022/43/7/ST10/00001 Project period: 08.09.2022 - 30.04.2024 (2029)
-
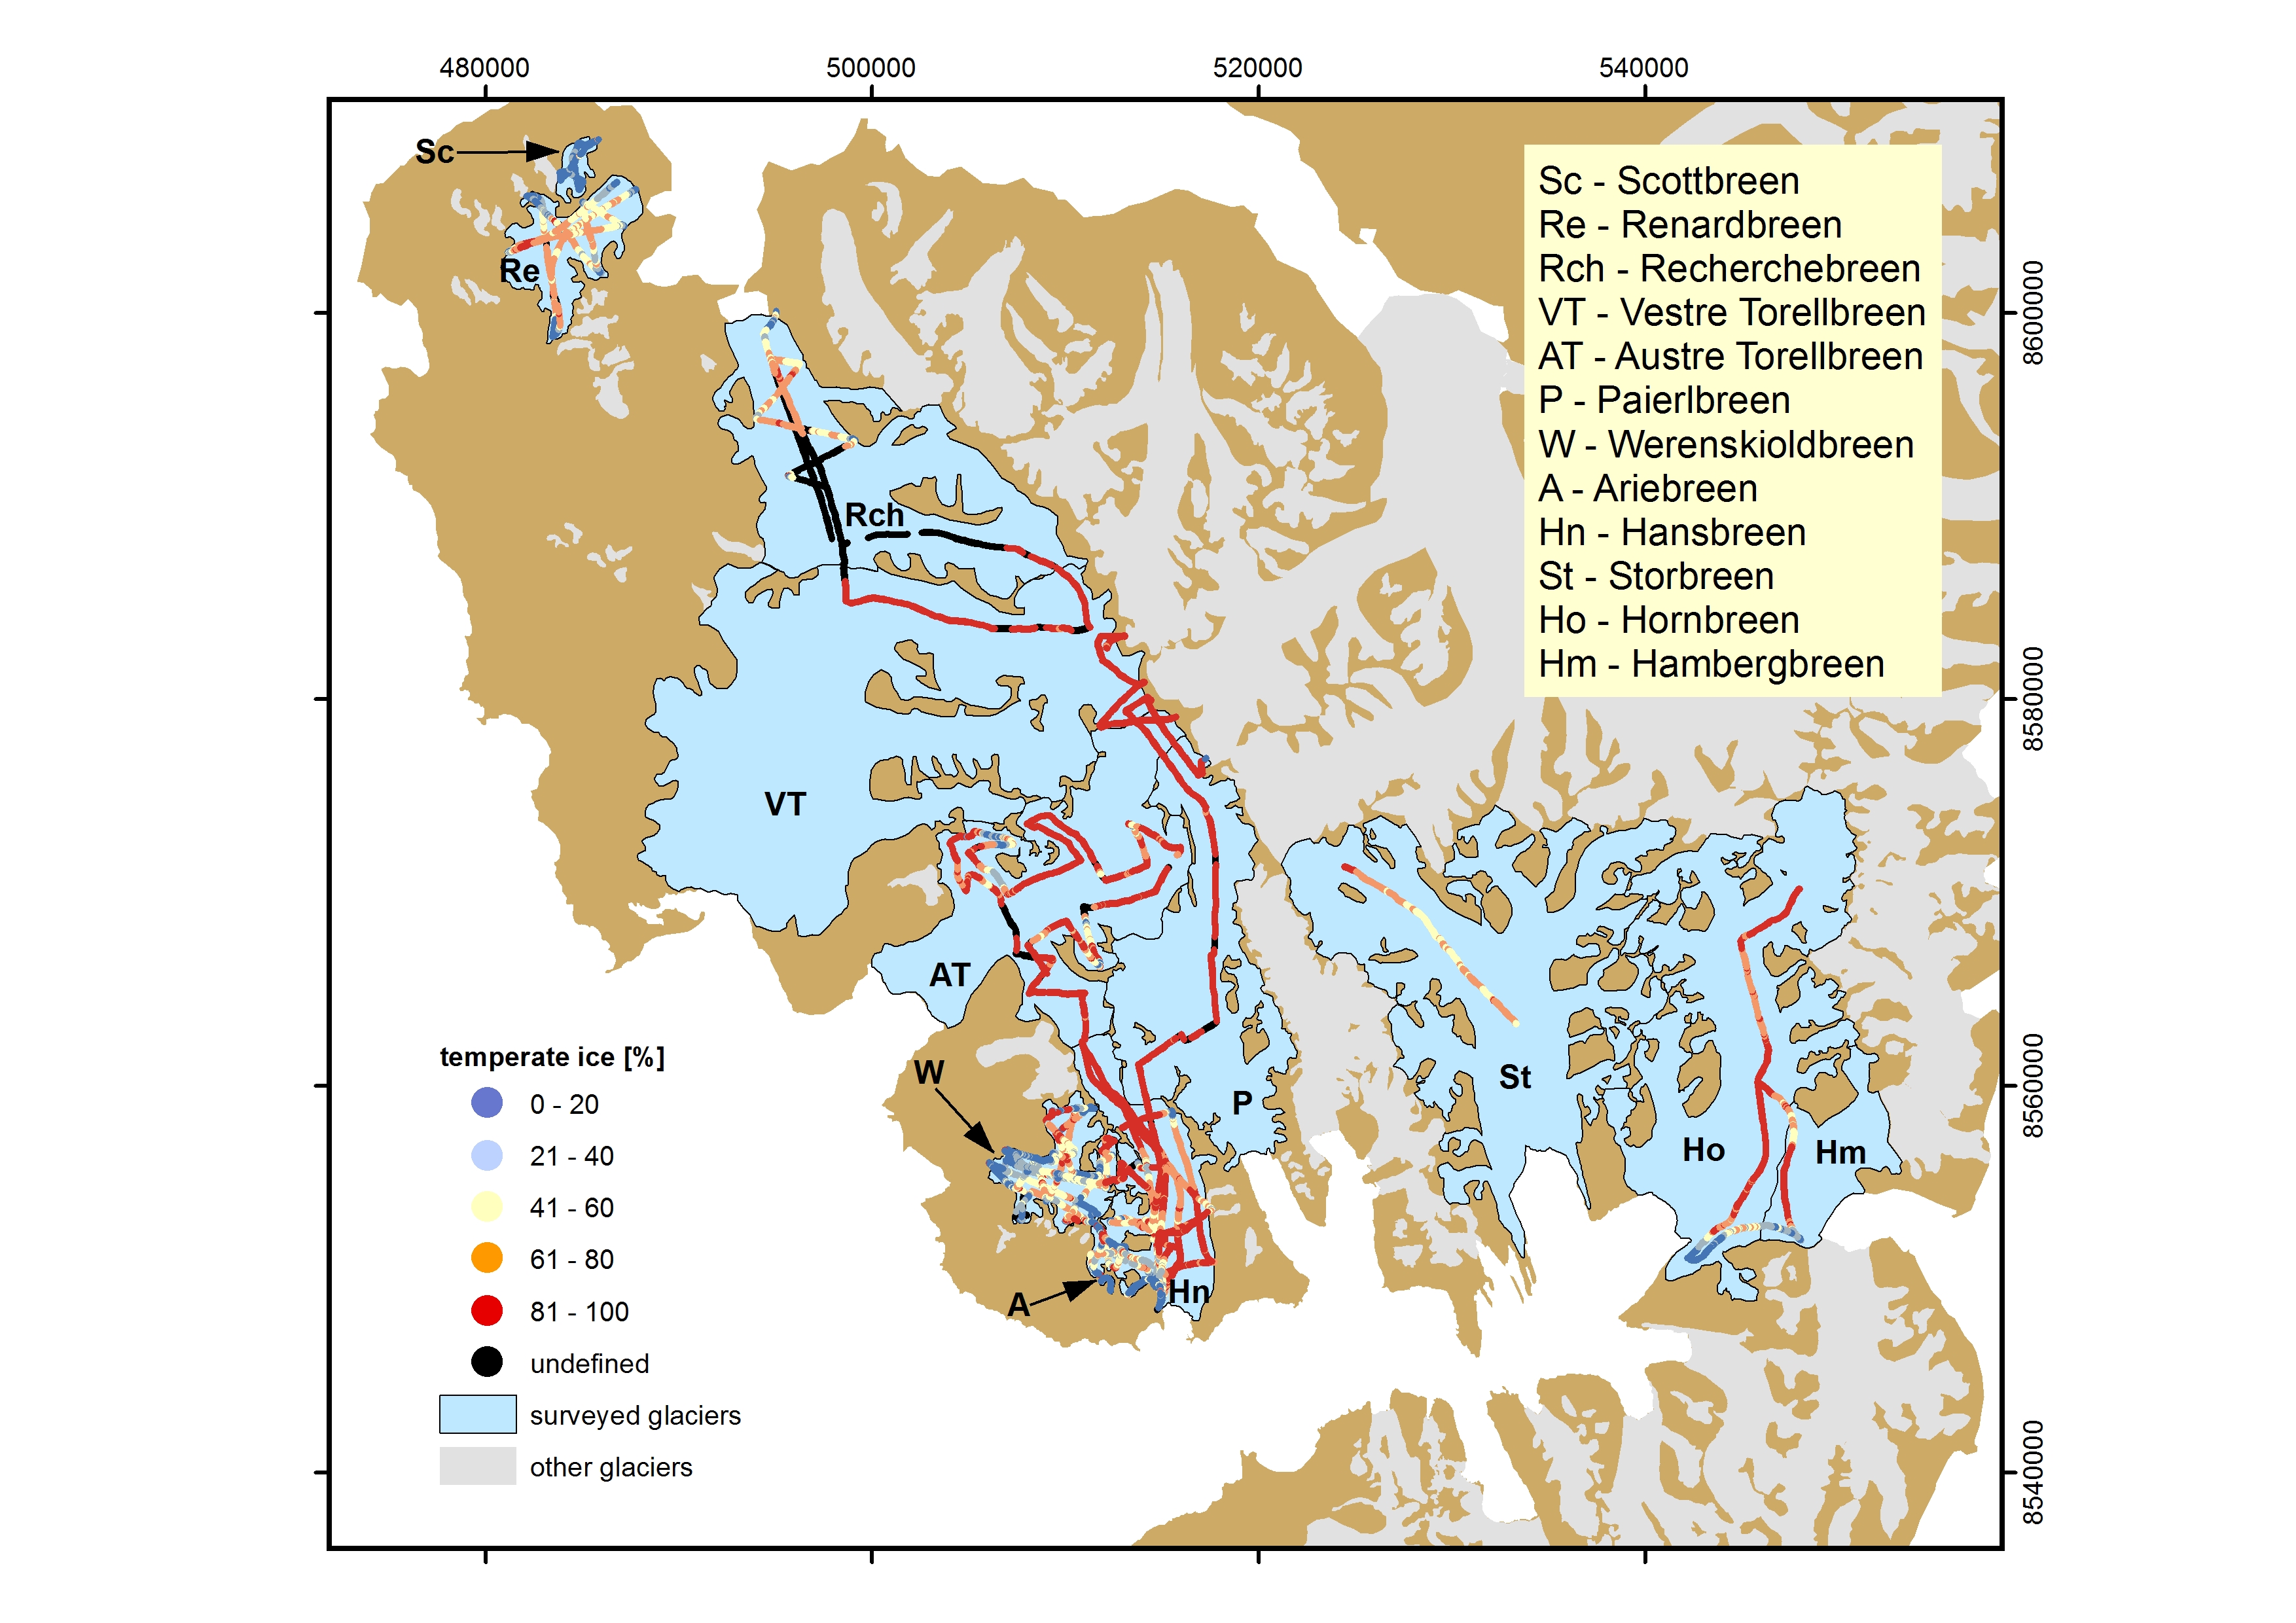
Thermal structure of selected S Spitsbergen glaciers was derived from ground based radio-echo sounding (RES). The division between cold and temperate ice layers is based on indirect interpretation of GPR (ground penetrating radar) image. Cold ice layer is virtually “transparent” for radio waves, while temperate ice layer is characterised by numerous diffractions on water inclusions. The database contains results from 479.7 km of RES profiles acquired in 2007-2014 on 12 glaciers in Wedel Jarlsberg Land and Torell Land (S Spitsbergen) including: Amundsenisen, Austre Torellbreen, Vestre Torellbreen, Hansbreen, Storbreen, Hornbreen, Hambergbreen, Recherchebreen, Scottbreen, Renardbreen, Werenskioldbreen and Ariebreen. Basic characteristics of investigated glaciers and its thermal structure is provided in table 1 (supplementary information). The surveys used GPR antennas in range 25-200 MHz, selected according to expected ice depth. Thanks to that on 87% of the profiles ice/bed interface has been identified. The radar system was pulled behind the snowmobile moving with velocity c. 20 km h-1. Applying trace interval 0.2-1.0 s, trace-to-trace distance was in range 1-5m. Trace positions were acquired by GNSS receivers working in navigation or differential mode with respective accuracy 3.0 m and 0.1m. RES data were processed applying standard filtering procedure (DC-offset, time-zero adjustment, 2-D filter, amplitude correction and bandpass filtering). Time-to-depth conversion used average radio wave velocity (RWV) for glacier ice 16.4 cm ns-1, 16.7 and 16.1 for cold and temperate ice respectively, based on CMP survey. More precise description of data collection, processing and quality is provided by Grabiec (2017). In S Spitsbergen polythermal glaciers are predominant. 57.8% of surveyed profiles consist of both: temperate and cold ice layers; 22.7% profiles is entirely temperate while 6.6% contains cold ice only (remaining profiles have undefined thermal structure). Studied glaciers represent broad spectrum of polythermal structure with cold-to-temperate ice ratio from 99:1% (Ariebreen) to 2:98% (accumulation zone of Vestre Torellbreen). The data were collected and processed under following projects: • IPY/269/2006 GLACIODYN The dynamic response of Arctic glaciers to global warming • UE FP7-ENV-2008-1 ice2sea Estimating the future contribution of continental ice to sea-level rise • PNRF-22-AI-1/07 AWAKE Arctic Climate and Environment of the Nordic Seas and the Svalbard – Greenland Area • NCBiR/PolarCLIMATE-2009/2-1/2010 SvalGlac Sensitivity of Svalbard glaciers to climate change • Pol-Nor/198675/17/2013 AWAKE-2 Arctic climate system study of ocean, sea ice and glaciers interactions in Svalbard area • 03/KNOW2/2014 KNOW Leading National Research Centre Reference: Grabiec M. 2017: Stan i współczesne zmiany systemów lodowcowych południowego Spitsbergenu w świetle badań metodami radarowymi. Wydawnictwo Uniwersytetu Śląskiego, 328 s.
-
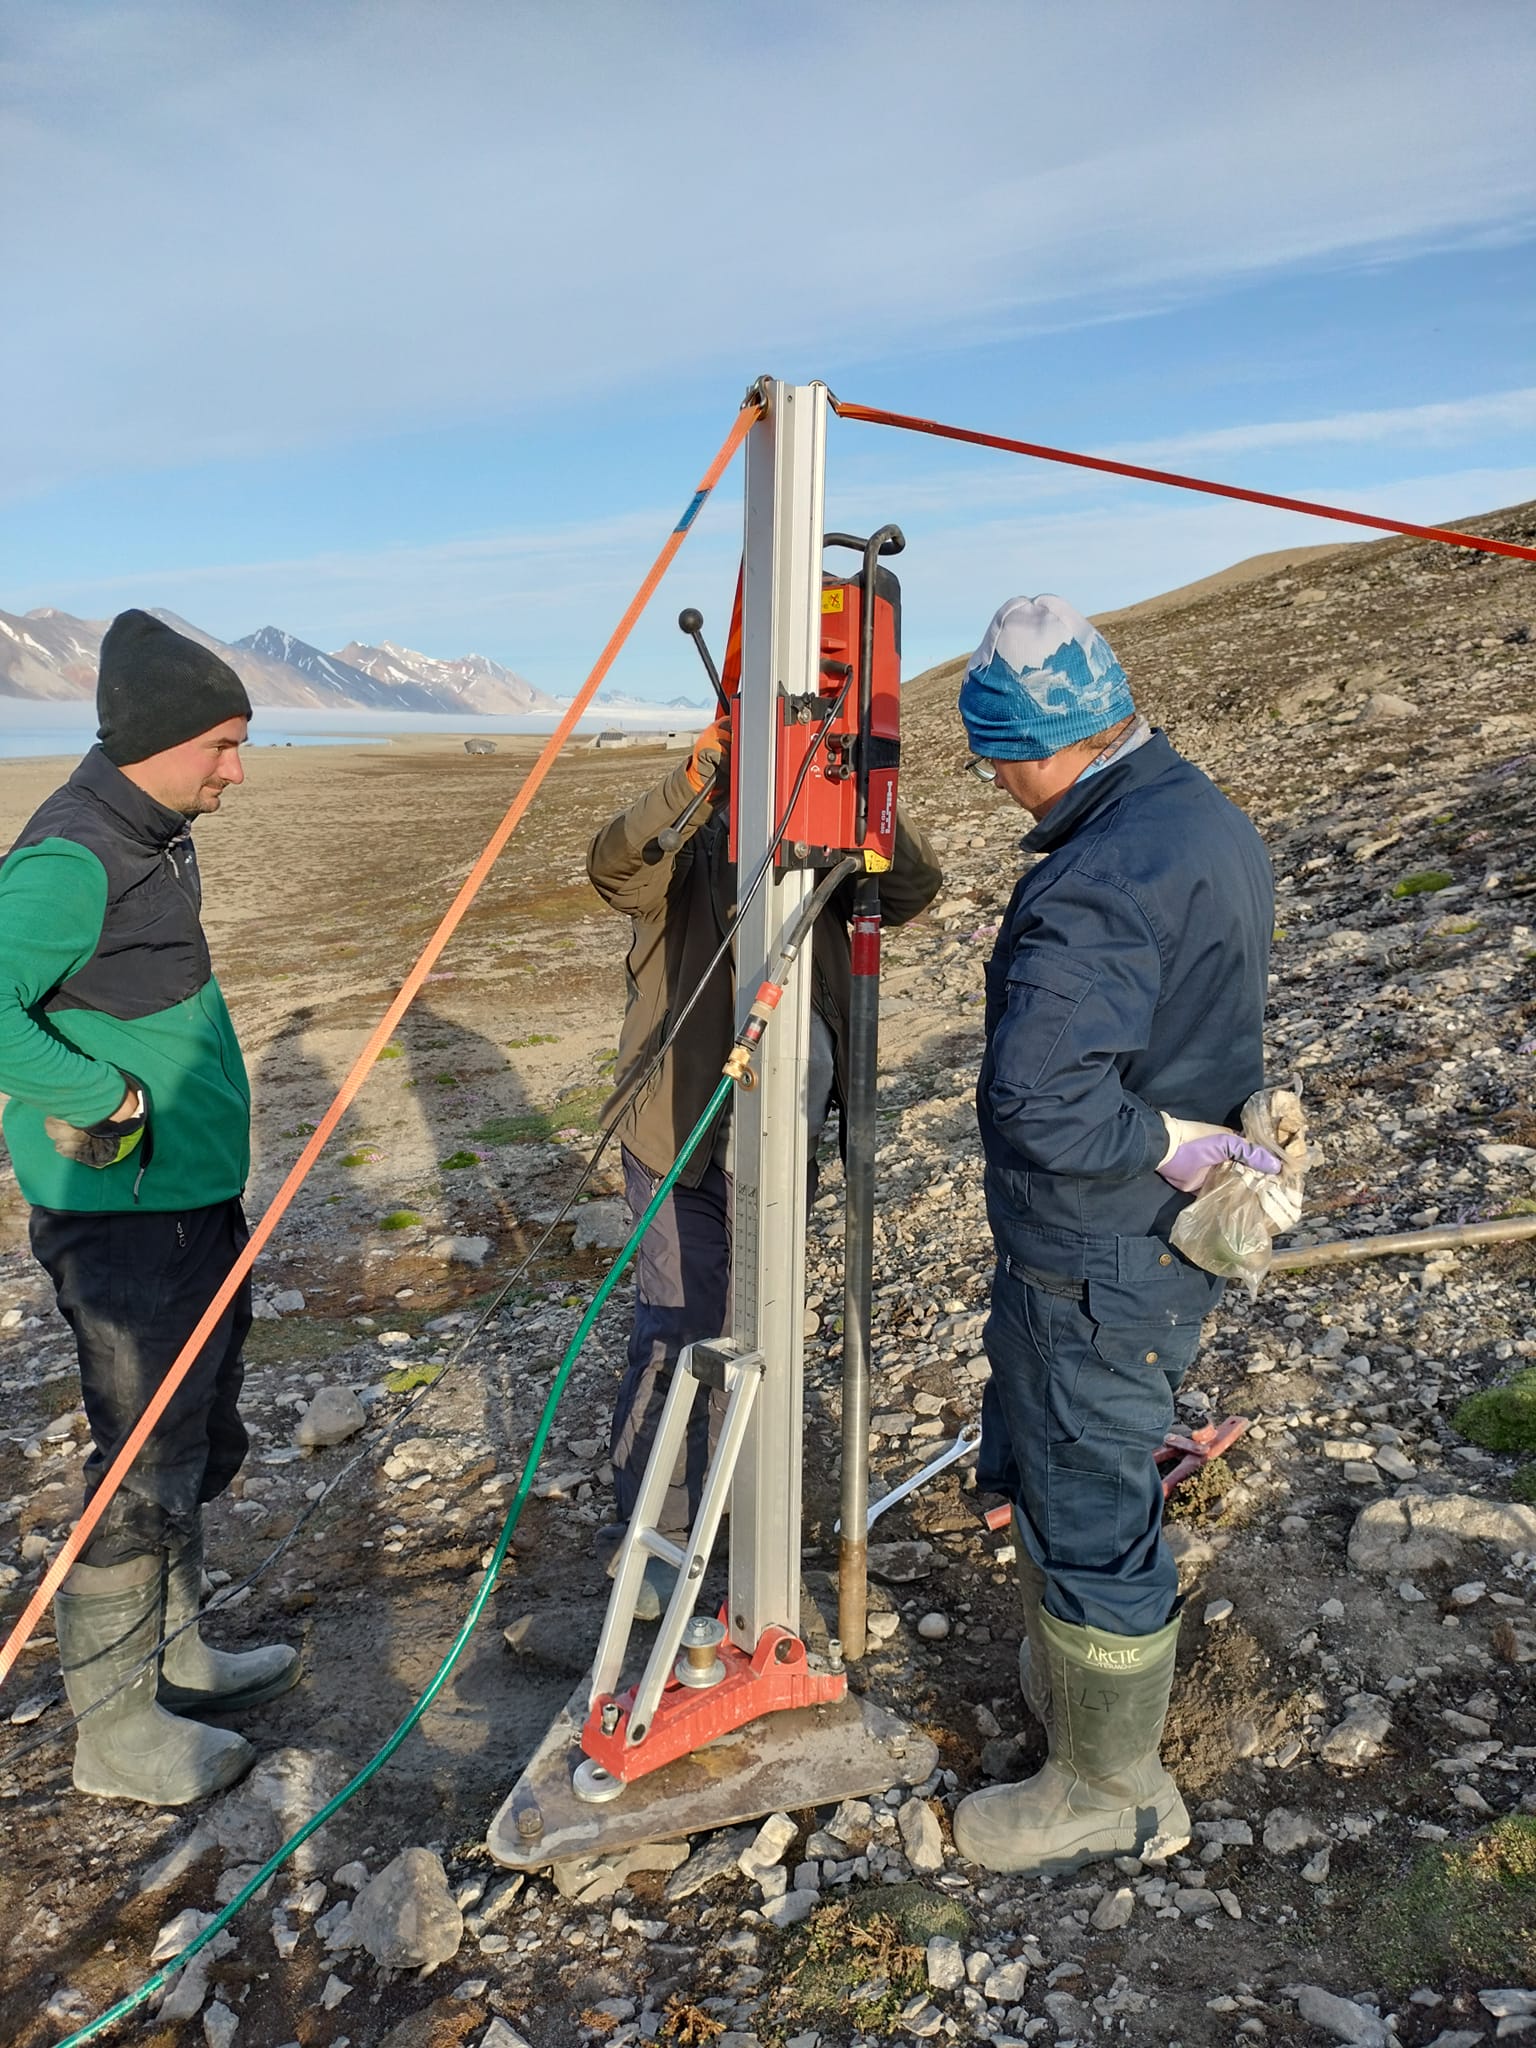
Permafrost monitoring System of thermistors (temperature strings with loggers) to monitor the ground thermal state Precise data on the thermal state of the frozen ground is one of the key missing components of the environmental monitoring at the research stations spread across Spitsbergen. The CRIOS project will allow us to equip the newly established borehole with precise temperature strings that will record ground thermal changes over the next couple of years. A system of temperature strings will be used in the monitoring of the thermal state of permafrost in drilled boreholes. Devices were tested in severe weather and are commonly used for permafrost monitoring by other research groups working in polar regions. Site Information The borehole near the UMK station in Kaffioyra was located at the existing meteorological garden, about 100 m from the shoreline. The drilling was carried out on 20-21.07.2023. The substrate is dominated by loose sandy-gravel beach sediments. A large amount of fine material and the formation of a core in a small part of the hole made it possible to reach a depth of 10.0 m below sea level. CRIOS – Cryosphere Integrated Observation Network on Svalbard Project financed from the EEA Financial Mechanism 2014-2021 operated by the National Science Centre in Poland Agreement no. UMO-2022/43/7/ST10/00001 to a predefined project no. 2022/43/7/ST10/00001 Project period: 08.09.2022 - 30.04.2024 (2029)
 Centre for Polar Studies