 Centre for Polar Studies
environment
Type of resources
Available actions
Topics
Keywords
Contact for the resource
Provided by
Years
Representation types
Update frequencies
status
Scale
-
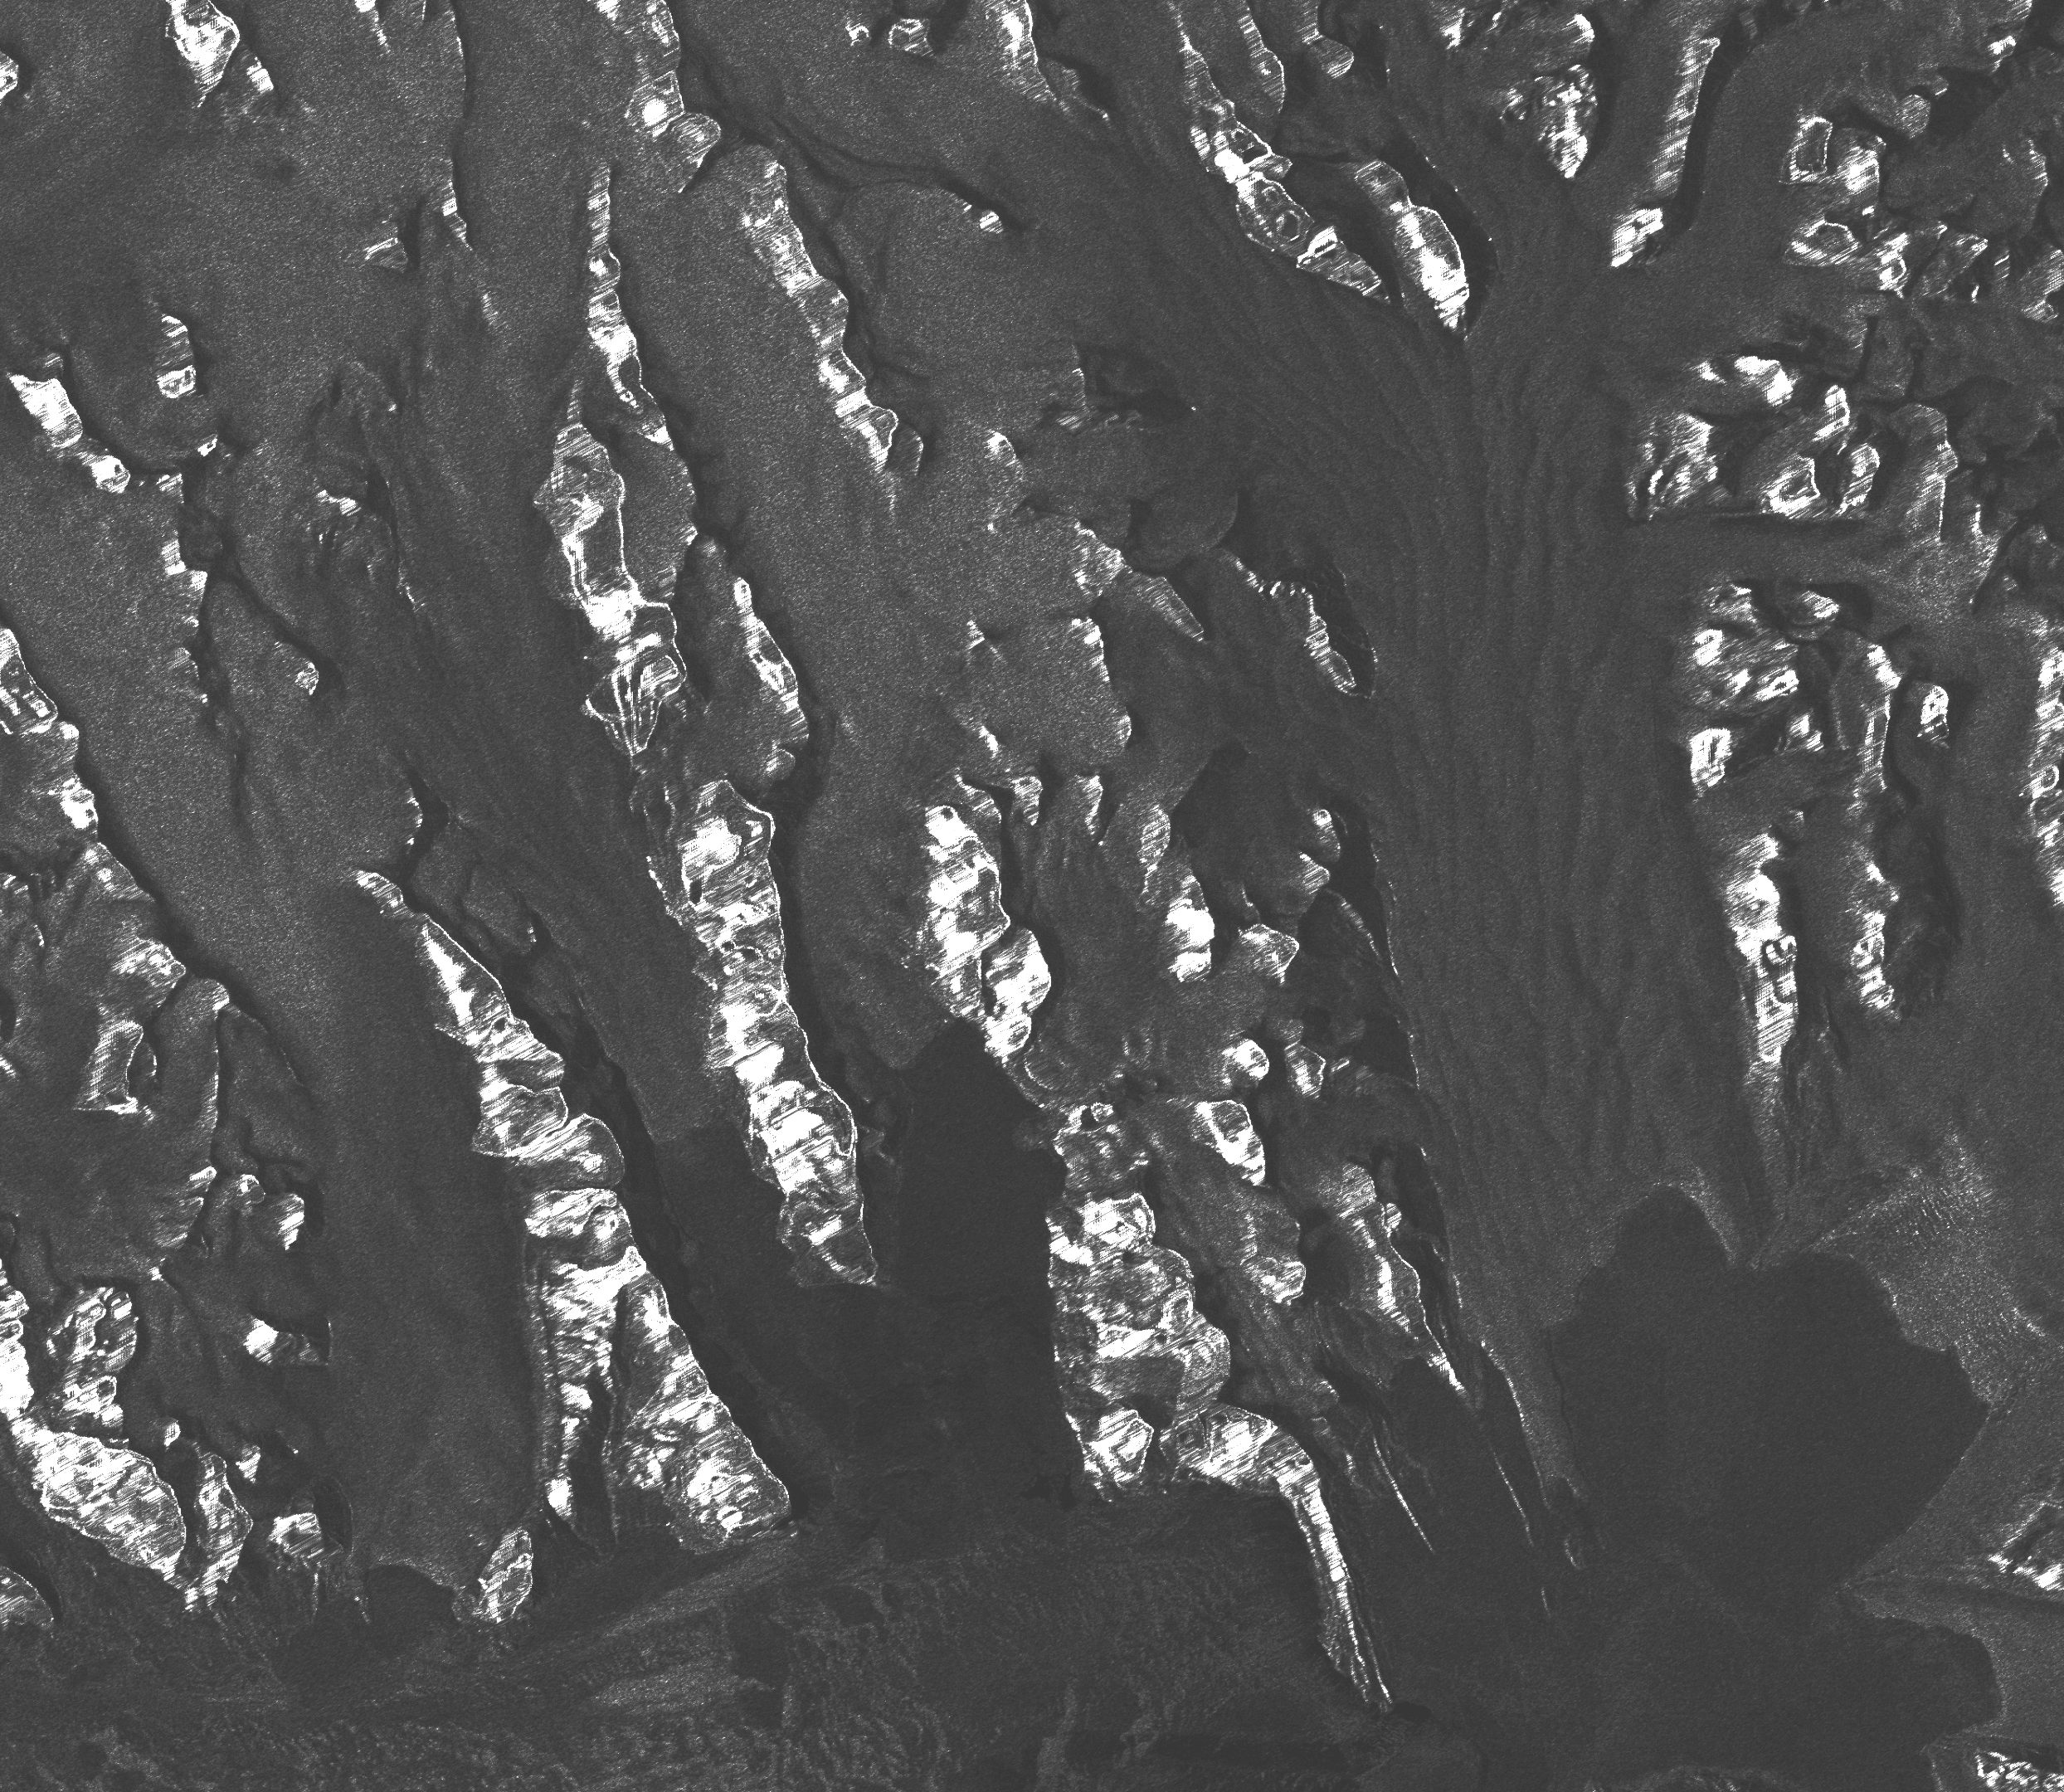
Radar satellite (SAR) images for Hornsund: ERS-1, ERS-2, ENVISAT, ALOS Palsar, TerraSAR-X, TandemX-1, acquired between 1992 and 2014. 210 archival SAR data were provided at the SLC level, so that both radiometric and geometric corrections were applied using the same methods, and with the same digital elevation model (2008 DEM SPOT developed by the IPY-SPIRIT Project; Korona et al., 2009). The SAR data were processed in BEAM (http://www.brockmann-consult.de/cms/web/beam).
-
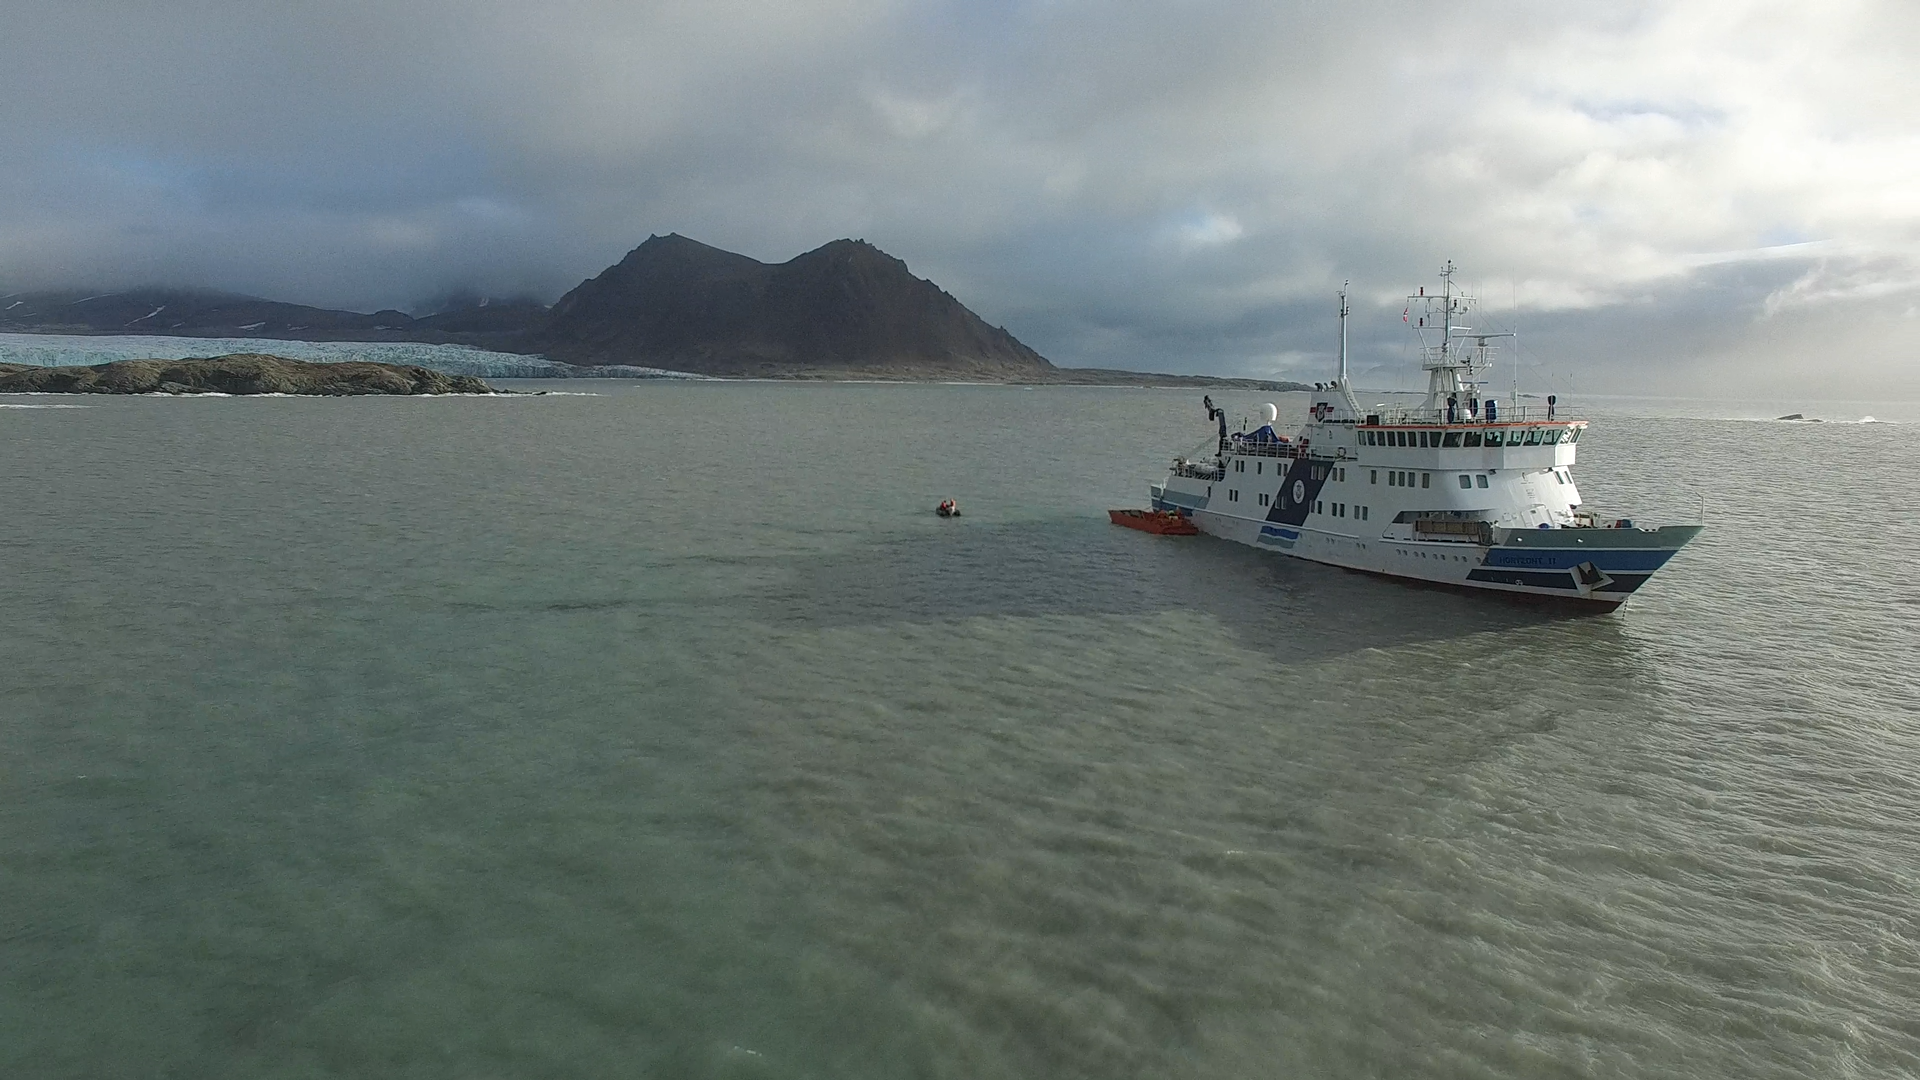
1. Two high-quality UAV movies taken in Hornsund fiord on 15th Sep 2016 with Phantom 3 Advanced usage. The movies are focused on Horyzont II ship during unloading goods to the Polish Polar Station Hornsund. Format file: .MOV. 2. Dataset consist six UAV movies taken in neighborhood of stake no. 4 of Hansbreen, one taken in the vicinty of stake no. 6 of Hansbreen and two on Tuvbreen. The movies from stake no. 4 show the ablation zone, crevasses, glaciers in the area and a team of University of Silesia scientists during maintanance of automatic weather station (AWS). The movie from stake no. 6 presents the surface of Hansbreen towards accumulation zone. The movies from Tuvbreen show the area around, surface of the glacier and University of Silesia team. UAV: Phantom 3 Advanced. Format file: .MOV. 3. One high-quality UAV movie taken from West morain of Paierbreen 22nd Aug 2016 with Phantom 3 Advanced usage. The movie is focused on the front of Paierlbreen. Format file: .MOV. 4. Two high-quality UAV movies taken on Silesiabreen 23nd Aug 2016 with Phantom 3 Advanced usage. The movie is focused on the snowline of Silesiabreen, University of Silesia scietists while fieldwork and neighbourhood. 5. UAV movie of Storbreen upper ablation area in 21st Aug 2016. 6. Three high-quality UAV movies taken from vicinity of Treskelen in Hornsund on 12 Sep 2016 with Phantom 3 Advanced usage. The movies are focused on the University of Silesia team during automatic weather station maintanance, sailing boat operated by scientists and Hornsund fiord. 7. A high-quality UAV movie taken from vicinity of Brateggbreen on 5 Sep 2016 with Phantom 3 Advanced usage. The movie is focused on Brateggbreen front and its proglacial lake. Format file: .MOV. 8. UAV movies of Werenskoildbreen front and morain in summer 2016
-
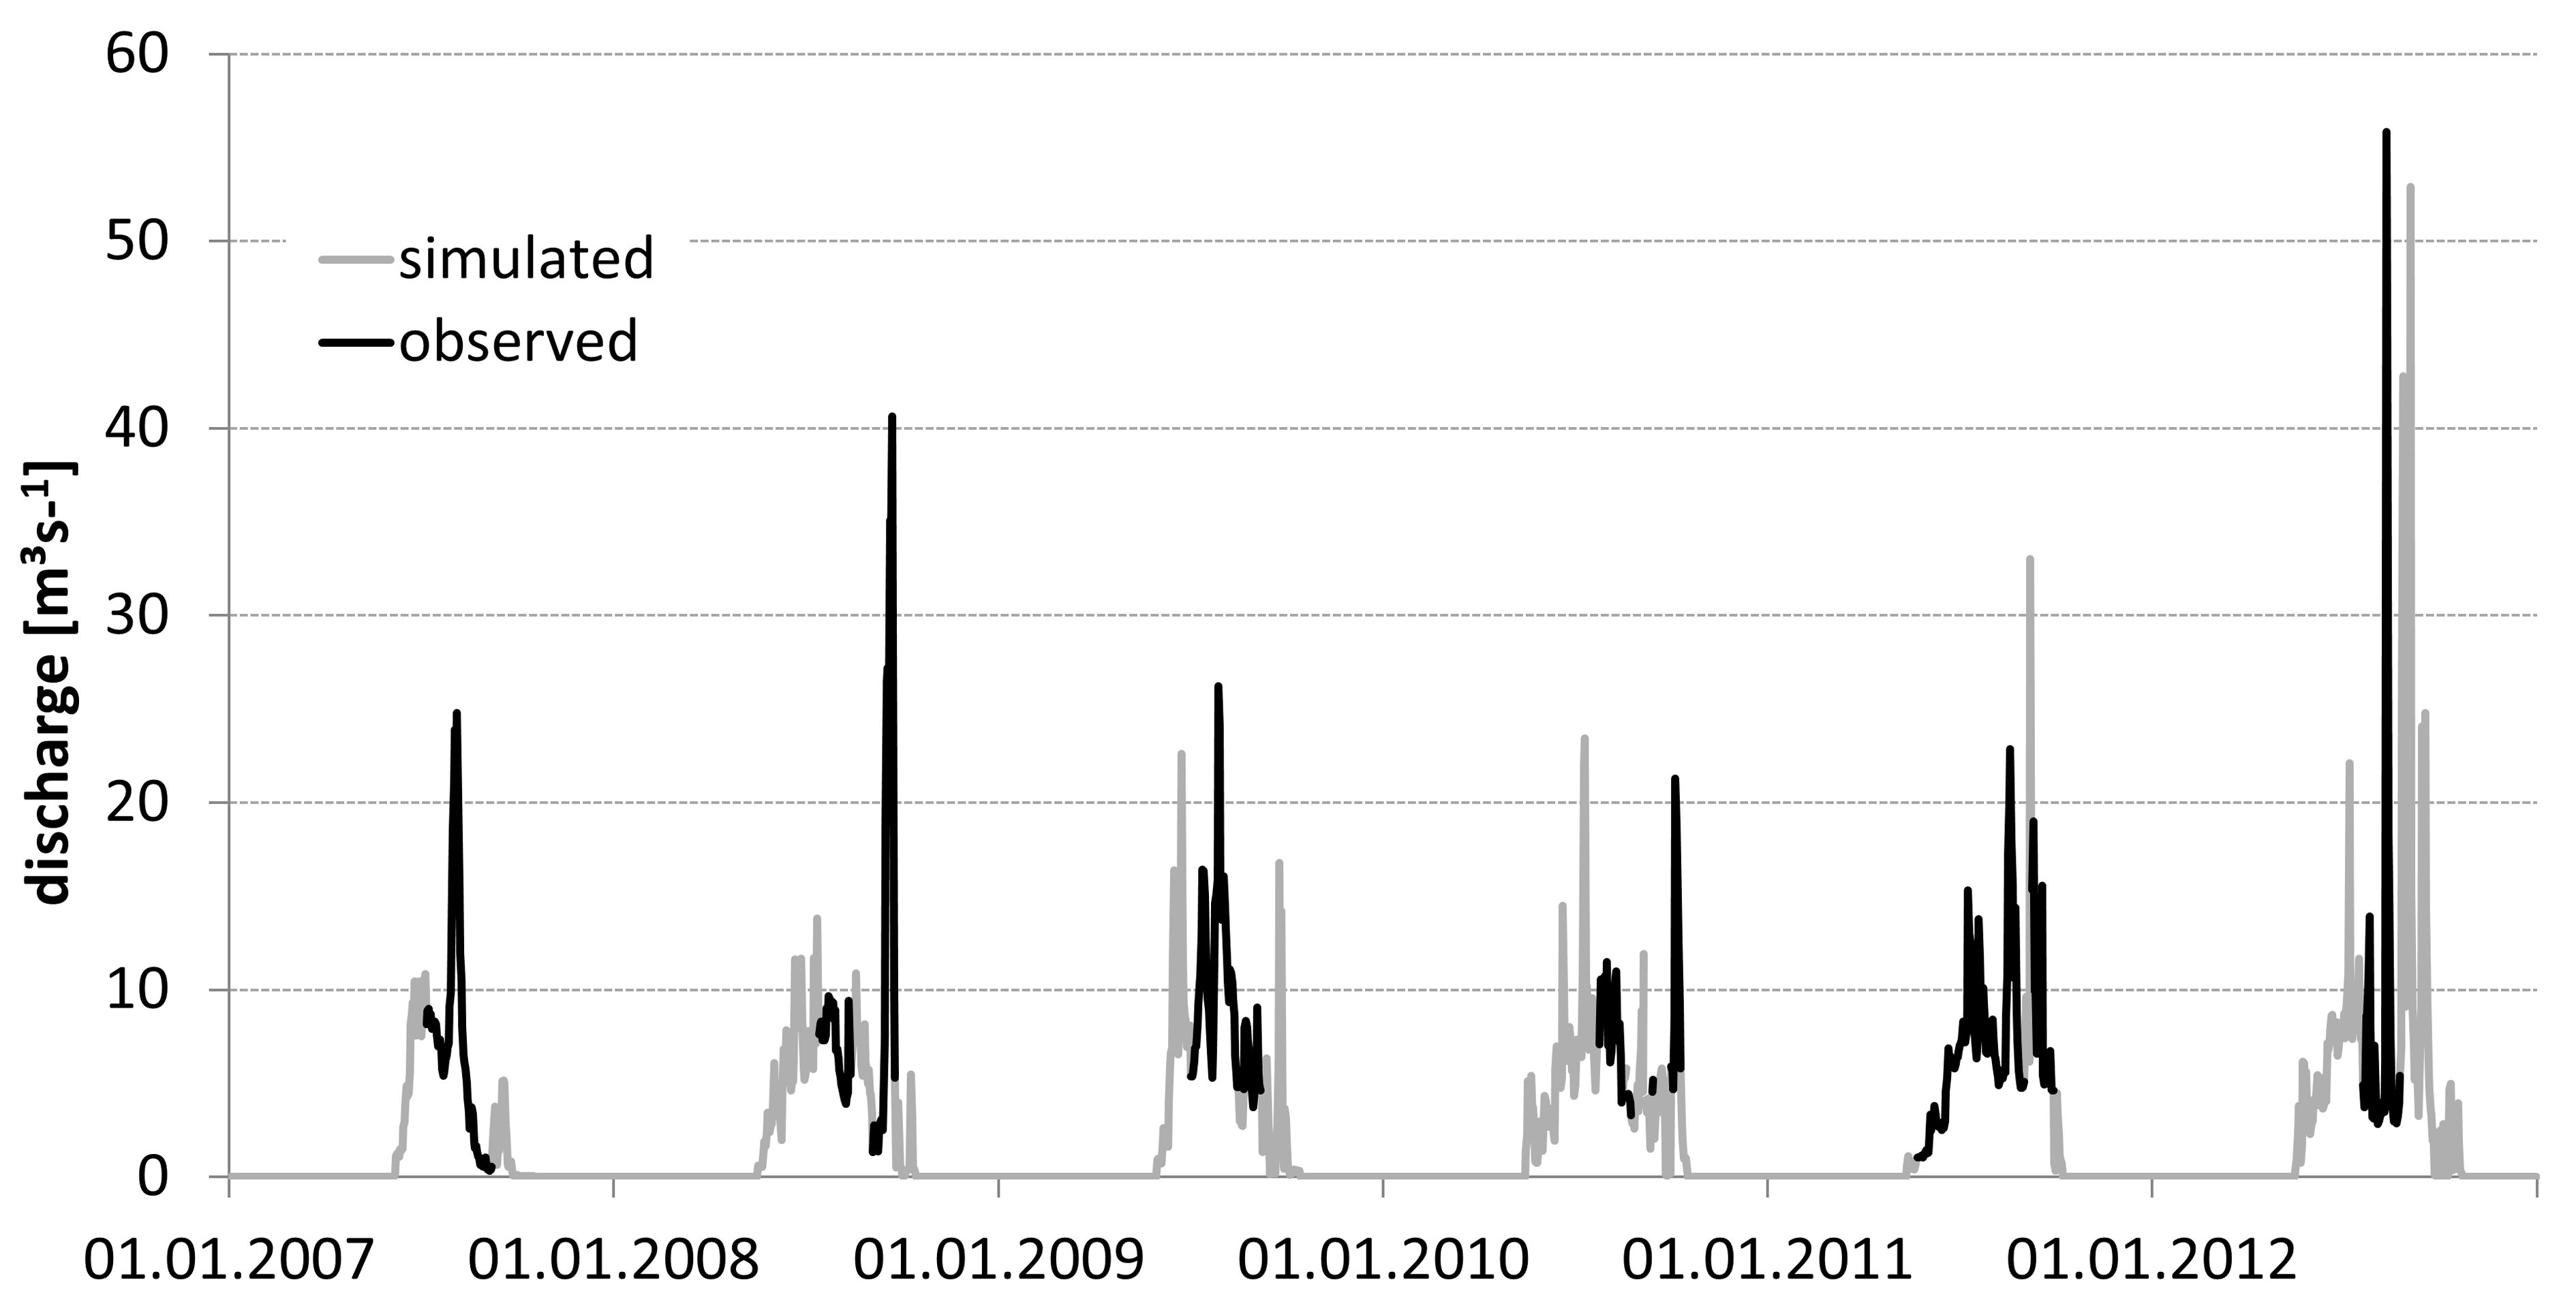
• Discharge measurements were conducted from May/June/July to September/October in the years 2007–2012. Direct observation periods were 62, 51, 61, 40, 121, and 35 days in the consecutive years. The data set was obtained from CTD-DIVER DI 261 or Mini-Diver (Van Essen Instruments, Delft, The Netherlands) logger with barometric compensation by BaroDiver (Schlumberger, Houston, TX, USA) with 10-min intervals and flow velocities were measured with a SEBA F1 current meter (SEBA Hydrometrie GmbH, Kaufbeuren, Germany). Mean daily discharge and total runoff in the hydrologically active season was calculated on the basis of the 24h running average of the water level and a rating curve (Appendix 1). More details have been reported by Majchrowska E., Ignatiuk D., Jania J., Marszałek H., Wąsik M., 2015: Seasonal and interannual variability in runoff from the Werenskioldbreen catchment, Spitsbergen. Polish Polar Research vol. 36, no. 3, pp. 197–224. doi: 10.1515/popore−2015−0014 • Hydrological data for Werenskioldbreen - archive of the University of Silesia. The base contain mean daily discharge in the years: 1972, 1973, 1974, 1979, 1980, 1983, 1985, 1986, 1988, 1998, 2007, 2008, 2009, 2010, 2011, 2012, 2013, 2017 (18 hydrologically active seasons) – Appendix 2
-
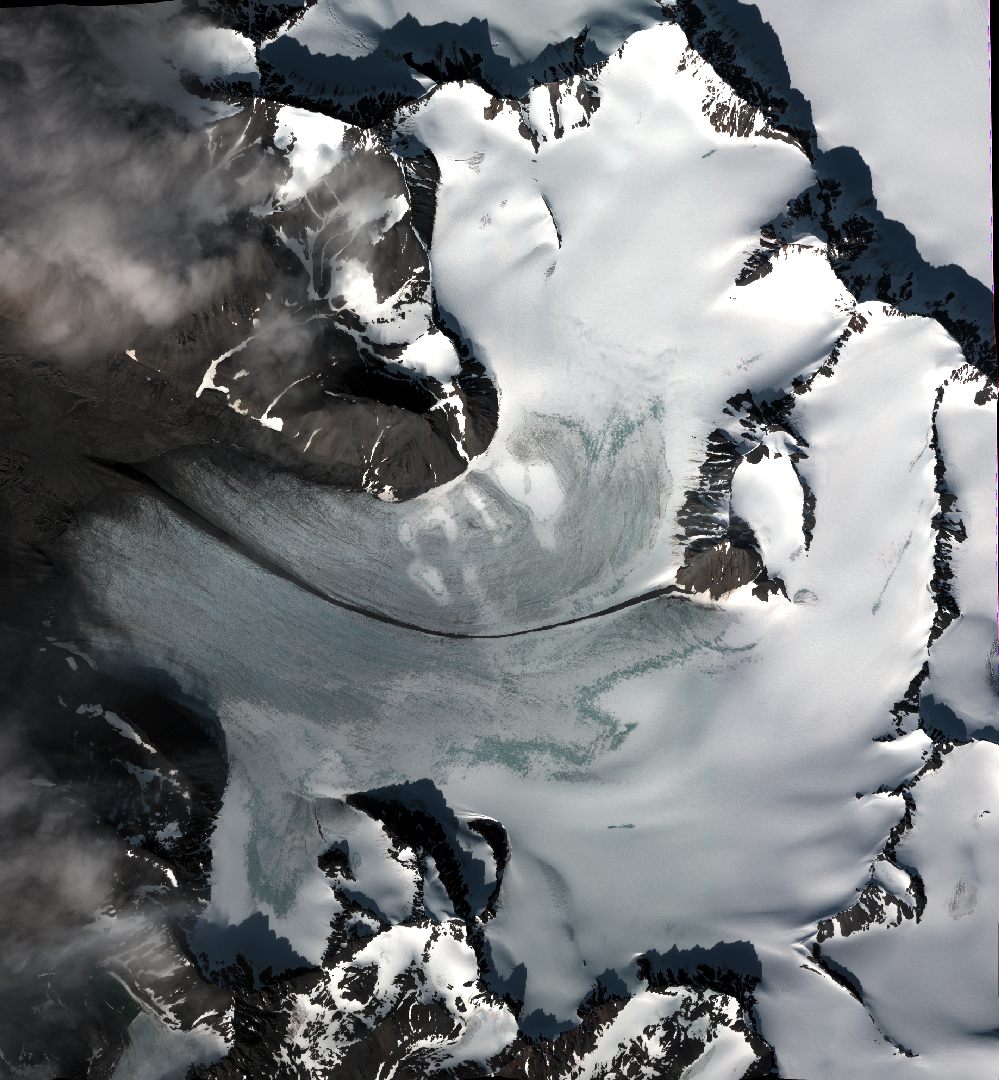
High resolution orthophoto images from Geoeye, WorldView-2 and Pléaides processed in OrthoEngine module of PCI Geomatica. Data format: grid, UTM 33X / EGM 2008. Spatial resolution: 0.5 m (panchromatic and pansharpened) and 2 m (multispectral).
-
Since 2010, continuous monitoring of the front zone of the Hansa Glacier with the use of Canon Eos 1000D photo cameras has been carried out (timelapse). Pictures in different periods of time were taken by 3 different cameras. Two cameras (106 and 107) were located on the Fugleberget slope and one (601) on the Baranowskiodden. The periods for which data are available and the interval of taking pictures are shown in Appendix 1.
-
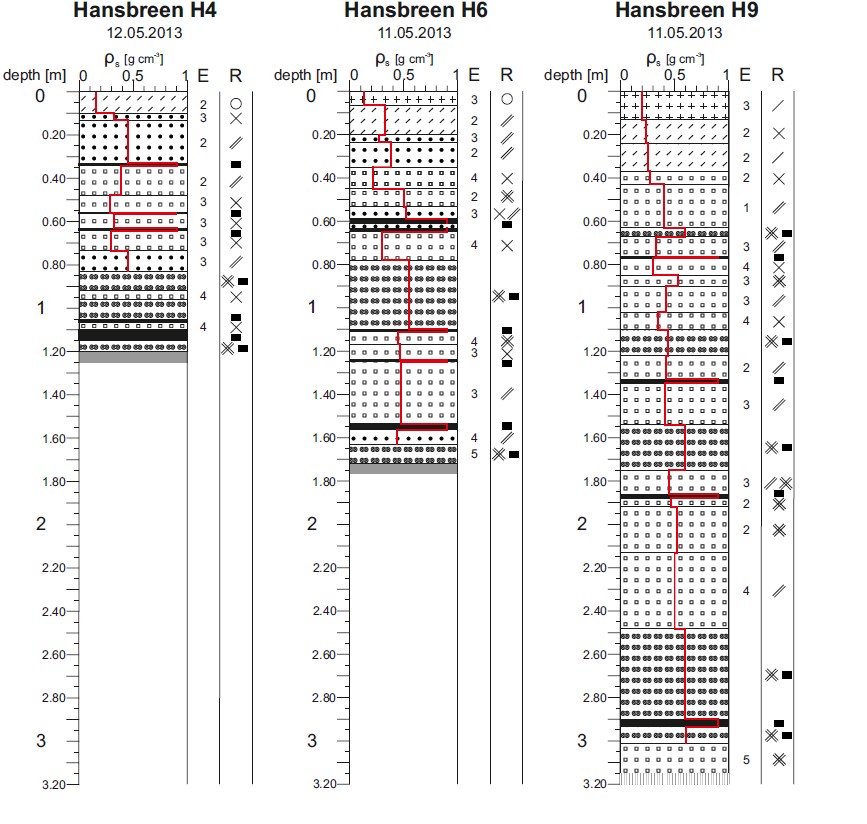
Dataset contains detailed measurements of physical features of seasonal snow cover, according to International Classification of Seasonal Snow on the Ground (Fierz et al. 2009). Fieldwork has been done during peak of accumulation on several glaciers in the region of Hornsund, Svalbard: Amundsenisen (2013) Hansbreen (three sites; 2010, 2012, 2013, 2014, 2015, 2017, 2018) Werenskioldbreen (two sites; 2013, 2015) Nannbreen (2013) Ariebreen (2014) Acknowledgements: Research Council of Norway, Arctic Field Grant 2013: Spatial distribution of snow cover and drainage systems on the glaciers on Wedel Jarlsberg Land (RiS ID: 6158); the National Science Centre PRELUDIUM 4: Role of meltwater from snow cover for supplying drainage systems of the Spitsbergen glaciers (2012/07/N/ST10/03784) References: Laska M., Luks B., Budzik T., 2016. Influence of snowpack internal structure on snow metamorphism and melting intensity on Hansbreen, Svalbard. Polish Polar Research, 37(2): 193–218. doi:10.1515/popore-2016-0012 Laska M., Grabiec M., Ignatiuk D., Budzik T., 2017. Snow deposition patterns on southern Spitsbergen glaciers, Svalbard, in relation to recent meteorological conditions and local topography. Geografiska Annaler, Series A: Physical Geography, 99(3): 262–287 doi:10.1080/04353676.2017.1327321 Laska M., Barzycka B., Luks B., 2017. Melting Characteristics of Snow Cover on Tidewater Glaciers in Hornsund Fjord, Svalbard. Water, 9(10), 804. doi:10.3390/w9100804
-
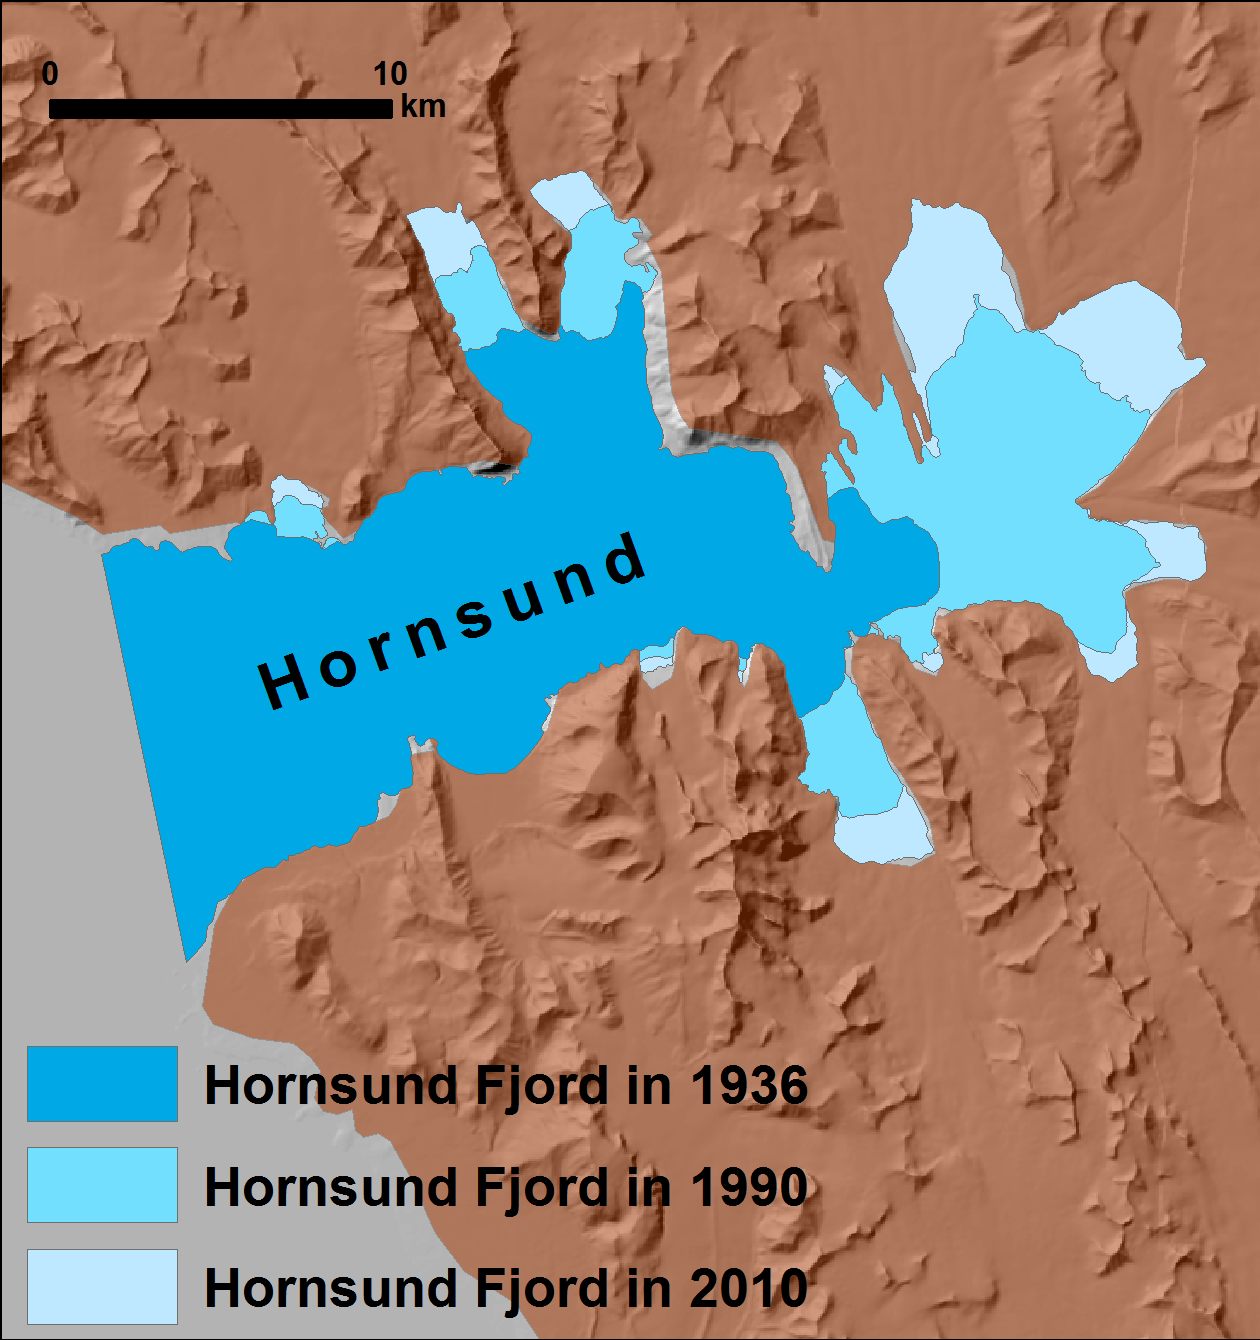
Hornsund area extracted from different archive data. Detailed description of the source data and accuracy data for glaciers from hydrological basin of Hornsund can be found in: Błaszczyk M., Jania J.A., Kolondra L., 2013: Fluctuations of tidewater glaciers in Hornsund Fiord (Southern Svalbard) since the beginning of the 20th century. Polish Polar Research, 34( 4): 327-352. http://journals.pan.pl/dlibra/publication/114504/edition/99557/content
-
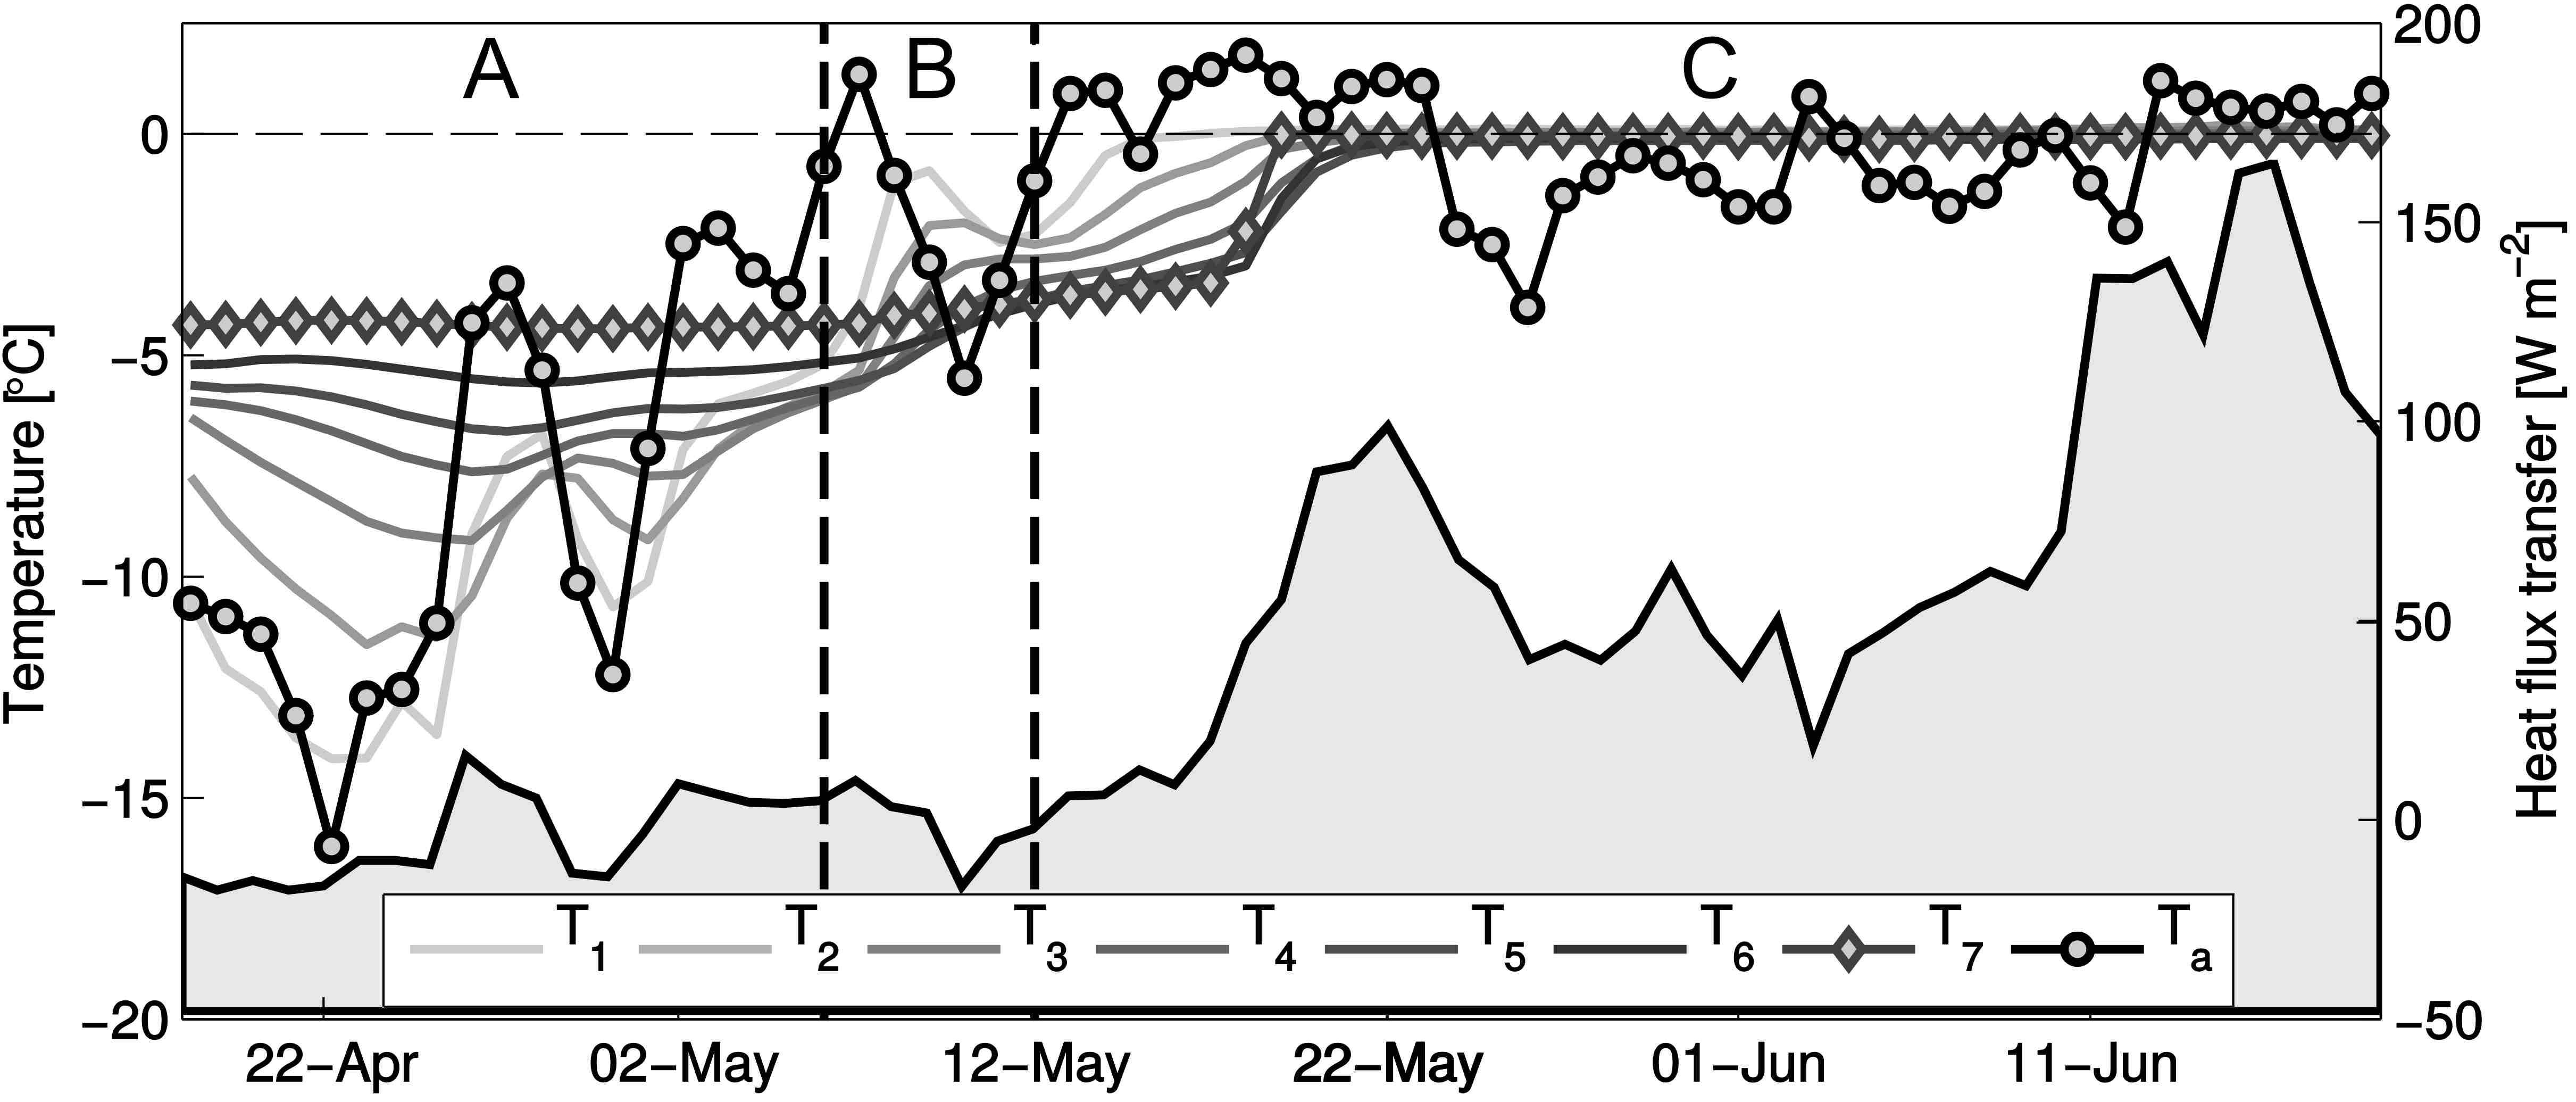
Dataset contains evolution of the snow temperature within seasonal snowpack on Hansbreen. Fieldwork has been performed with several thermistors located at different levels (from snow surface to the bottom, on glacier ice) from April to July 2010 (during period of early and intensive surface melting). Study has been repeated in 2015, at the same location. Acknowledgements: Research Council of Norway, Arctic Field Grant 2013: Spatial distribution of snow cover and drainage systems on the glaciers on Wedel Jarlsberg Land (RiS ID: 6158); the National Science Centre PRELUDIUM 4: Role of meltwater from snow cover for supplying drainage systems of the Spitsbergen glaciers (2012/07/N/ST10/03784) References: Laska M., Luks B., Budzik T., 2016. Influence of snowpack internal structure on snow metamorphism and melting intensity on Hansbreen, Svalbard. Polish Polar Research, 37(2): 193–218. doi:10.1515/popore-2016-0012
-
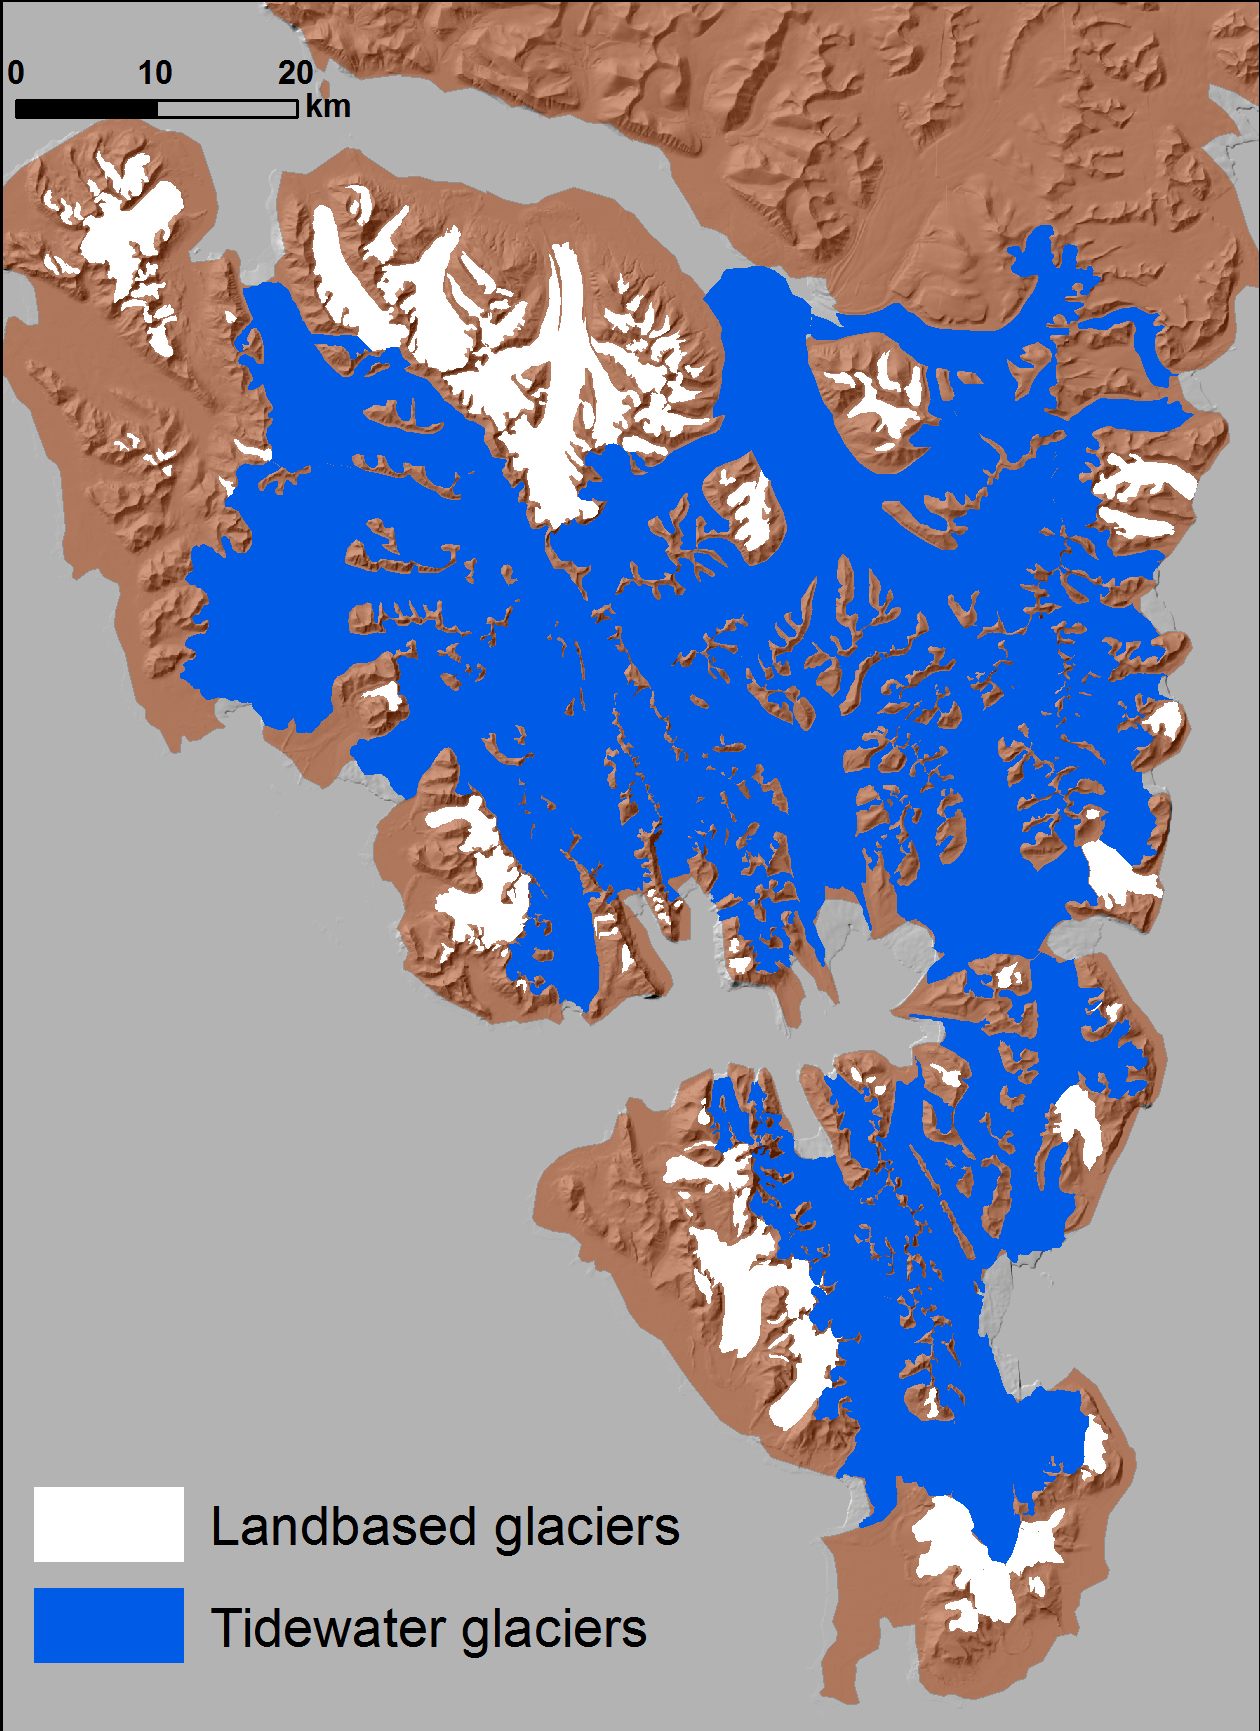
Inventory of tidewater and landbased glaciers delineated from archival satellite images (ASTER, Landsat) for Southern Spitsbergen. Tidewater glaciers are delineated based on satellite data from 2010. Landbased glacier are extracted from different satellite data (2005-2010). Shapefiles have basic information in the attribute table (name, ID, area, type of glaciers). Detailed description of the source data and accuracy data for glaciers from hydrological basin of Hornsund can be found in: Błaszczyk M., Jania J.A., Kolondra L., 2013: Fluctuations of tidewater glaciers in Hornsund Fiord (Southern Svalbard) since the beginning of the 20th century. Polish Polar Research, 34( 4): 327-352.http://journals.pan.pl/dlibra/publication/114504/edition/99557/content
-
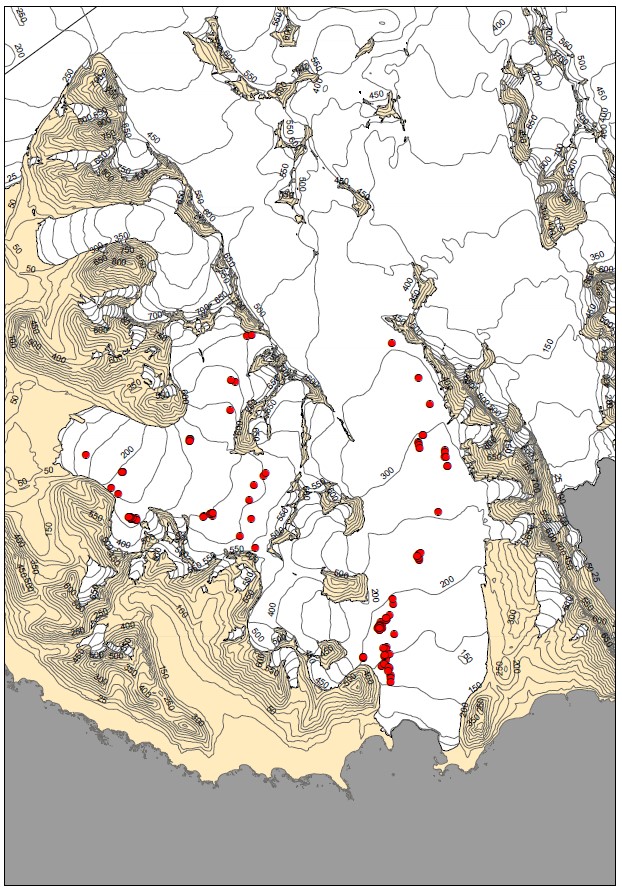
Dataset contains location of glacial shafts (moulins) on two polythermal glaciers: Werenskioldbreen and Hansbreen. Fieldwork has been done with GPS device at the end of ablation season in 2015. Acknowledgements: Research Council of Norway, Arctic Field Grant 2013: Spatial distribution of snow cover and drainage systems on the glaciers on Wedel Jarlsberg Land (RiS ID: 6158); the National Science Centre PRELUDIUM 4: Role of meltwater from snow cover for supplying drainage systems of the Spitsbergen glaciers (2012/07/N/ST10/03784)