 Centre for Polar Studies
University of Silesia
Type of resources
Available actions
Topics
Keywords
Contact for the resource
Provided by
Representation types
Update frequencies
status
-
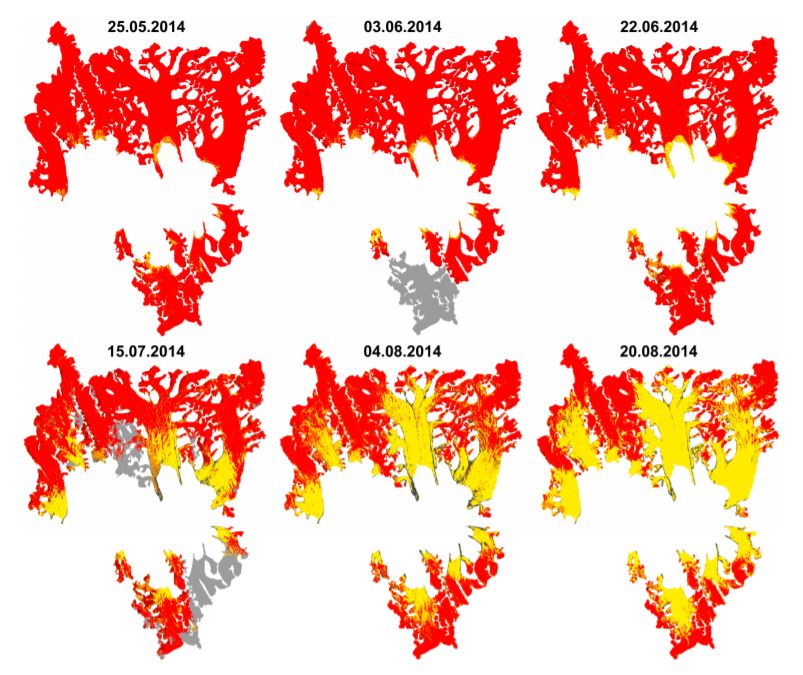
Results of supervised classification of six Landsat 8 images acquired on: 25 May, 3 June, 22 June, 15 July, 4 August and 20 August 2014, covering glaciers in Hornsund fiord. Method of classification: Maximum Likelihood. The results show variability of snow cover areas in melting period of 2014 for glaciers located in Hornsund fiord and larger than 9 km2 (Körberbreen, Samarinbreen, Chomjakovbreen, Mendelejevbreen, Svalisbreen, Hornbreen, Storbreen, Kvalfangarbreen, Mühlbacherbreen, Paierlbreen and Hansbreen). For more information, please check: https://doi.org/10.3390/w9100804 Overview: Results of Maximum Likelihood classification of Landsat 8 images for analysed glaciers. Red - snow cover, yellow - glacier ice, black - debirs, grey - cloud cover.
-
The monitoring of the mass balance of the Werenskioldbreen (Wedel Jarlsberg Land, Spitsbergen, Svalbard) in the years 1999-2002 and 2009-2018. It is calculated on the base of 4 to 9 ablation stakes (depend on year). The mass balance is determined by conducting field surveys on floating calendar dates (floating-date system). Data have also been submitted to the World Glacier Monitoring Sevice (WGMS, https://wgms.ch)
-
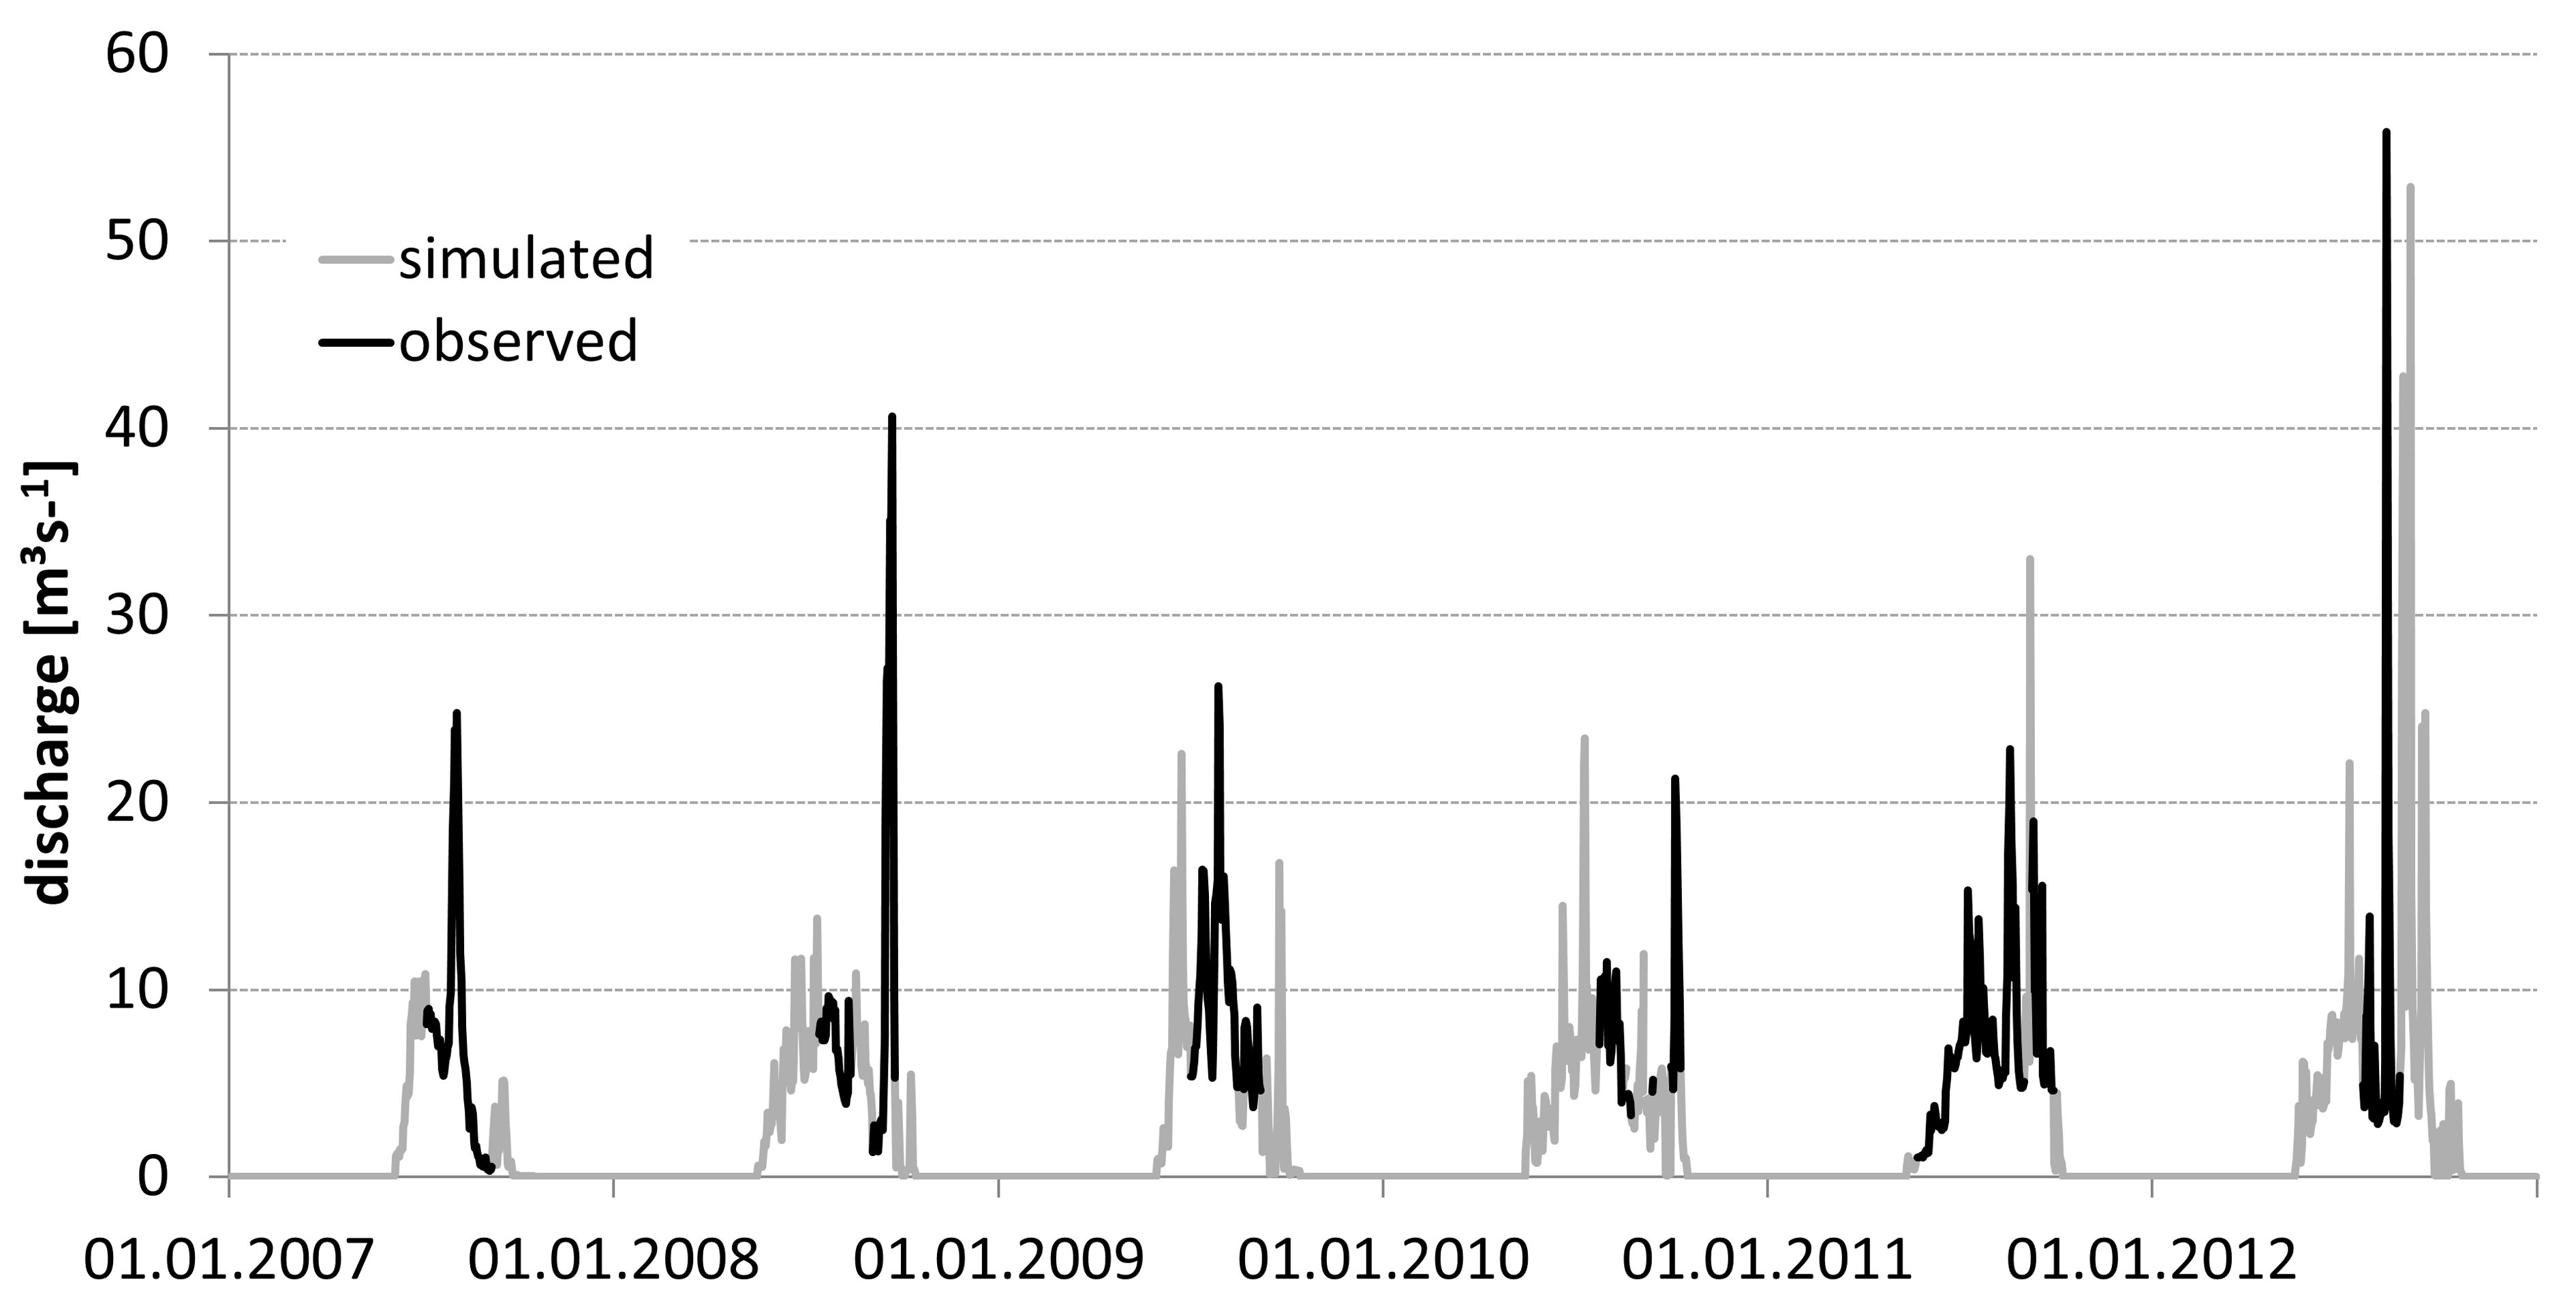
• Discharge measurements were conducted from May/June/July to September/October in the years 2007–2012. Direct observation periods were 62, 51, 61, 40, 121, and 35 days in the consecutive years. The data set was obtained from CTD-DIVER DI 261 or Mini-Diver (Van Essen Instruments, Delft, The Netherlands) logger with barometric compensation by BaroDiver (Schlumberger, Houston, TX, USA) with 10-min intervals and flow velocities were measured with a SEBA F1 current meter (SEBA Hydrometrie GmbH, Kaufbeuren, Germany). Mean daily discharge and total runoff in the hydrologically active season was calculated on the basis of the 24h running average of the water level and a rating curve (Appendix 1). More details have been reported by Majchrowska E., Ignatiuk D., Jania J., Marszałek H., Wąsik M., 2015: Seasonal and interannual variability in runoff from the Werenskioldbreen catchment, Spitsbergen. Polish Polar Research vol. 36, no. 3, pp. 197–224. doi: 10.1515/popore−2015−0014 • Hydrological data for Werenskioldbreen - archive of the University of Silesia. The base contain mean daily discharge in the years: 1972, 1973, 1974, 1979, 1980, 1983, 1985, 1986, 1988, 1998, 2007, 2008, 2009, 2010, 2011, 2012, 2013, 2017 (18 hydrologically active seasons) – Appendix 2
-
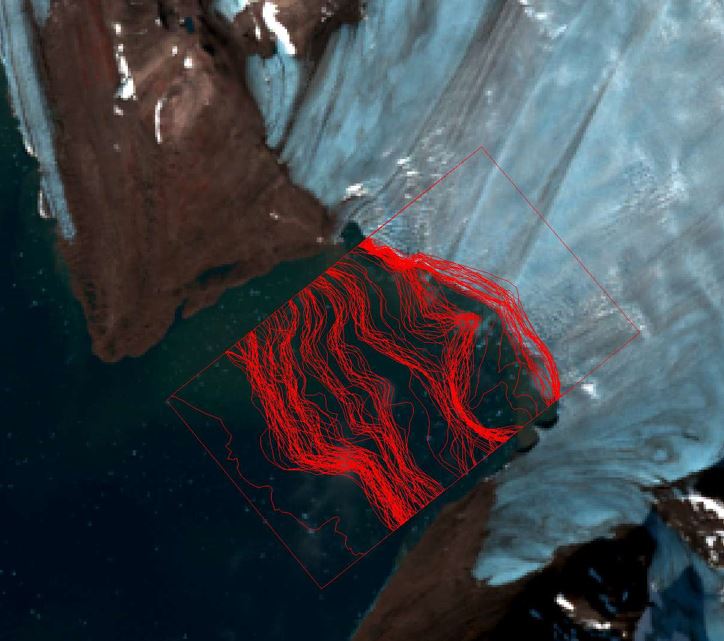
The positions of the glacier termini in Hornsund are derived with very high frequency in the period 1991–2018. Over 230 multispectral and Synthetic Aperture Radar (SAR) data were used: LANDSAT 5, LANDSAT 7, LANDSAT 8, Terra ASTER, Alos AVNIR, SPOT 5, ERS-1, ERS-2, ENVISAT, Alos PALSAR, TerraSAR-X, TanDEM-X, and Sentinel-1. SAR data were used to detect any variability in the glacier front during the polar night. The satellite data were digitized manually to obtain the ice cliff position. Multispectral images were orthorectified and geocoded in PCI Geomatica and ArcGIS software. SAR data were usually provided at the SLC level, so that both radiometric and geometric corrections could be applied using the same methods, and with the same digital elevation model (2008 DEM SPOT developed by the IPY-SPIRIT Project; Korona et al., 2009). The SAR data were processed in BEAM (http://www.brockmann-consult.de/cms/web/beam). Sentinel data downloaded from the Sentinel’s Data Hub were already processed. Data not published.
-
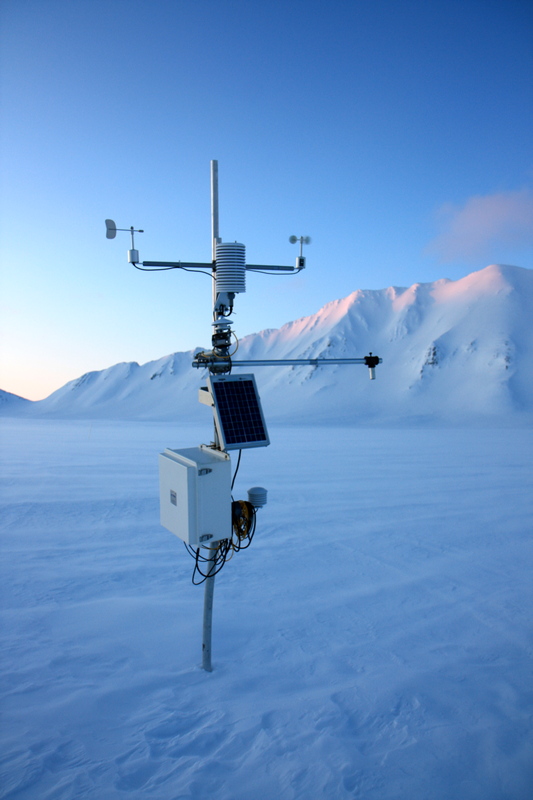
The database contains irregular meteorological data collected from the Hans Glacier (Hansbreen) in the years 2007-2017 as part of the polar expeditions of the University of Silesia in Spitsbergen / Svalbard. Data from three automatic weather stations. Measured elements: air temperature, air humidity, wind direction, wind speed, elements of radiation balance, others.
-
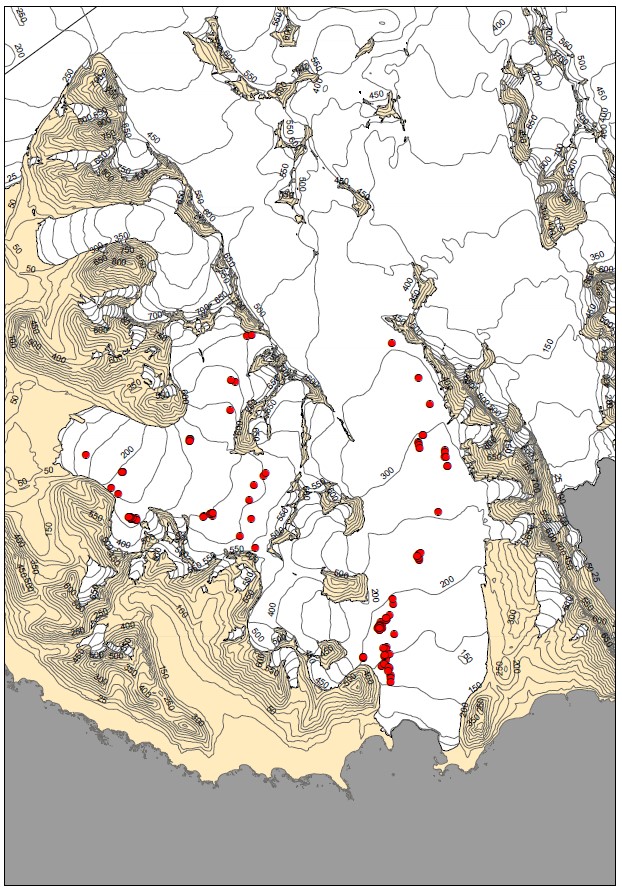
Dataset contains location of glacial shafts (moulins) on two polythermal glaciers: Werenskioldbreen and Hansbreen. Fieldwork has been done with GPS device at the end of ablation season in 2015. Acknowledgements: Research Council of Norway, Arctic Field Grant 2013: Spatial distribution of snow cover and drainage systems on the glaciers on Wedel Jarlsberg Land (RiS ID: 6158); the National Science Centre PRELUDIUM 4: Role of meltwater from snow cover for supplying drainage systems of the Spitsbergen glaciers (2012/07/N/ST10/03784)
-
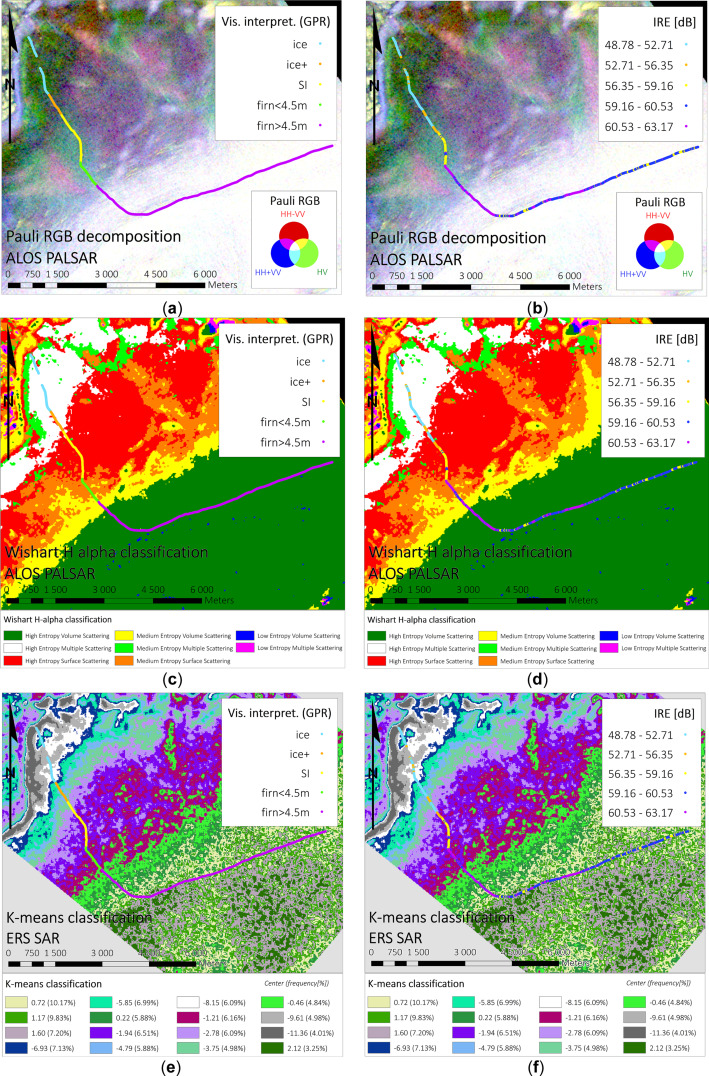
Glaciers facies extents of Vestfonna delivered from unsupervised classifications of SAR data (fully-polarimetric ALOS PALSAR, single polarimetric ERS-2 SAR) for 2009 year. Date of SAR images acquisitions: 4, 7, 20, 23, 26 May 2009 (VV Single Look Complex ERS-2 SAR), 22 May 2009 (ALOS PALSAR Single Look Complex 1.1, quad polarimetry). Method of classification: K-means classification, H-a Wishart Classification. Results validated with Ground Penetrating Radar data. For more information, please check: https://doi.org/10.1016/j.rse.2018.11.020 Overwiew of results of different classification methods with comparison to GPR data. Top panel: Pauli decomposition, middle panel: H-a Wishart classification, bottom panel: k-means classification. For more information, please check: https://doi.org/10.1016/j.rse.2018.11.020 (Figure 7).
-
Dataset contains snowpack density derived from shallow snow cores. Fieldwork has been done during peak of accumulation on several glaciers in the region of Hornsund, Svalbard: Amundsenisen (2013) Werenskioldbreen (2013, 2015) Nannbreen (2013) Flatbreen (2013, 2018) Storbreen (2013, 2018) Results might be valuable i.a. for mass-balance estimations or GPR survey validation. Acknowledgements: Research Council of Norway, Arctic Field Grant 2013: Spatial distribution of snow cover and drainage systems on the glaciers on Wedel Jarlsberg Land (RiS ID: 6158); the National Science Centre PRELUDIUM 4: Role of meltwater from snow cover for supplying drainage systems of the Spitsbergen glaciers (2012/07/N/ST10/03784); Citation: LASKA M.,GRABIEC M.,IGNATIUK D.,BUDZIK T.,2017. Snow deposition patterns on southern Spitsbergen glaciers, Svalbard, in relation to recent meteorological conditions and local topography. Geografiska Annaler, Series A: Physical Geography, 99(3): 262–287. doi:10.1080/04353676.2017.1327321
-
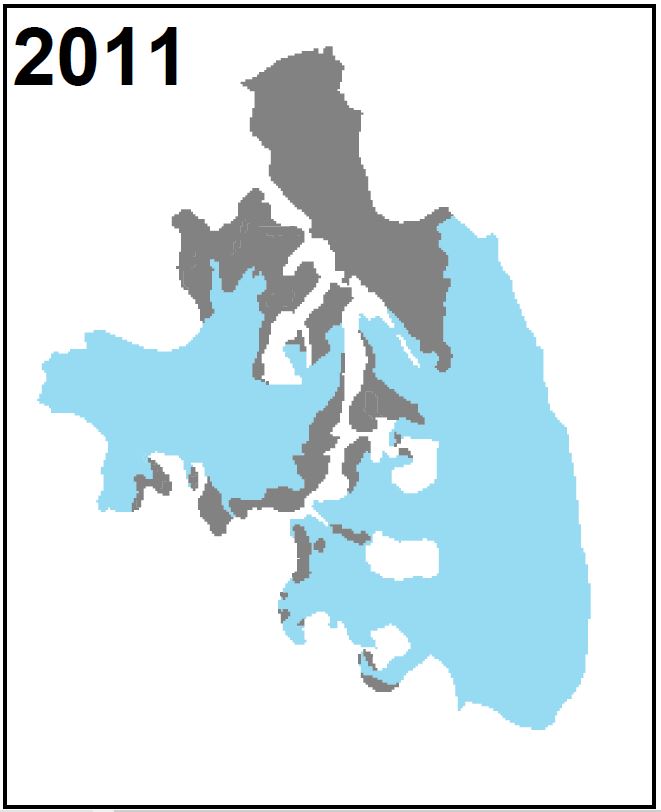
Firn extents of Hansbreen and Werenskoildbreen delivered from unsupervised classifications of single, dual and fully-polarimetric SAR data (ALOS-2 PALSAR, RADARSAT-2, Sentinel-1, ERS-2 SAR) between 2011 and 2017. Methods of classification: unsupervised ISO classification, H-a Wishart Classification. Results validated with terrestrial measurements (shallow ice cores drilling, Ground Penetrating Radar measurements). Research supported by the European Space Agency, Third Party Missions grant and Svalbard Science Forum, Arctic Field Grant 2018. For more details, please e-mail to this adress: bbarzycka@us.edu.pl.
-
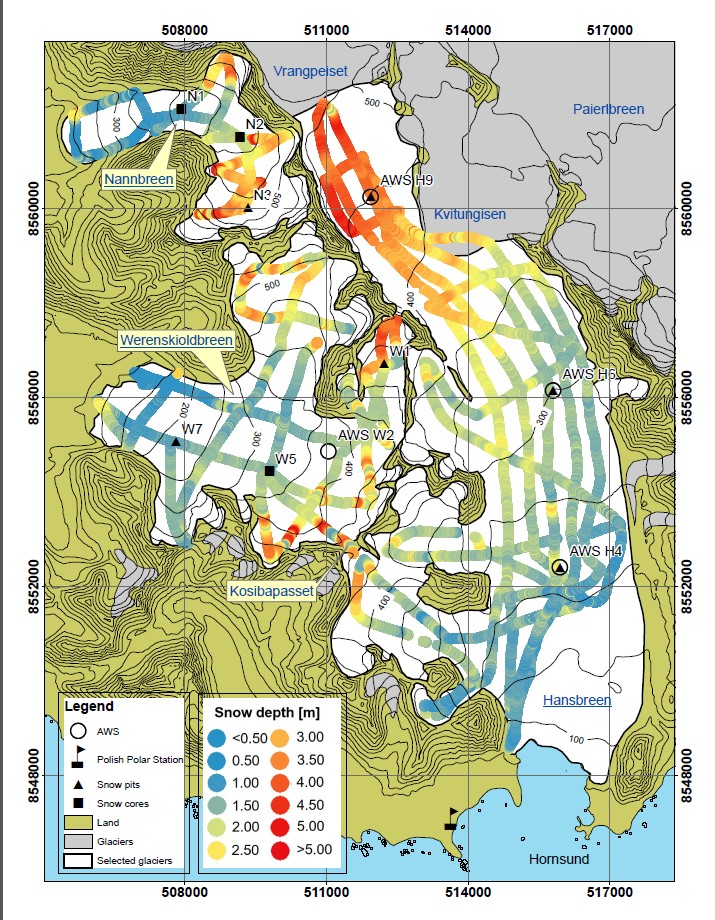
Dataset contains results of GPR survey performed with 800 MHz antennas for snow depth calculation. Fieldwork has been done during peak of accumulation, along repeated profiles on several glaciers in the region of Hornsund, Svalbard: Amundsenisen (2013) Werenskioldbreen (2013, 2014, 2015) Nannbreen (2013) Ariebreen (2014) Flatbreen (2018) Storbreen (2018) Acknowledgements: Research Council of Norway, Arctic Field Grant 2013: Spatial distribution of snow cover and drainage systems on the glaciers on Wedel Jarlsberg Land (RiS ID: 6158); the National Science Centre PRELUDIUM 4: Role of meltwater from snow cover for supplying drainage systems of the Spitsbergen glaciers (2012/07/N/ST10/03784); References: LASKA M.,GRABIEC M.,IGNATIUK D.,BUDZIK T.,2017. Snow deposition patterns on southern Spitsbergen glaciers, Svalbard, in relation to recent meteorological conditions and local topography. Geografiska Annaler, Series A: Physical Geography, 99(3): 262–287. doi:10.1080/04353676.2017.1327321