 Centre for Polar Studies
asNeeded
Type of resources
Available actions
Topics
Keywords
Contact for the resource
Provided by
Years
Formats
Representation types
Update frequencies
status
Scale
-
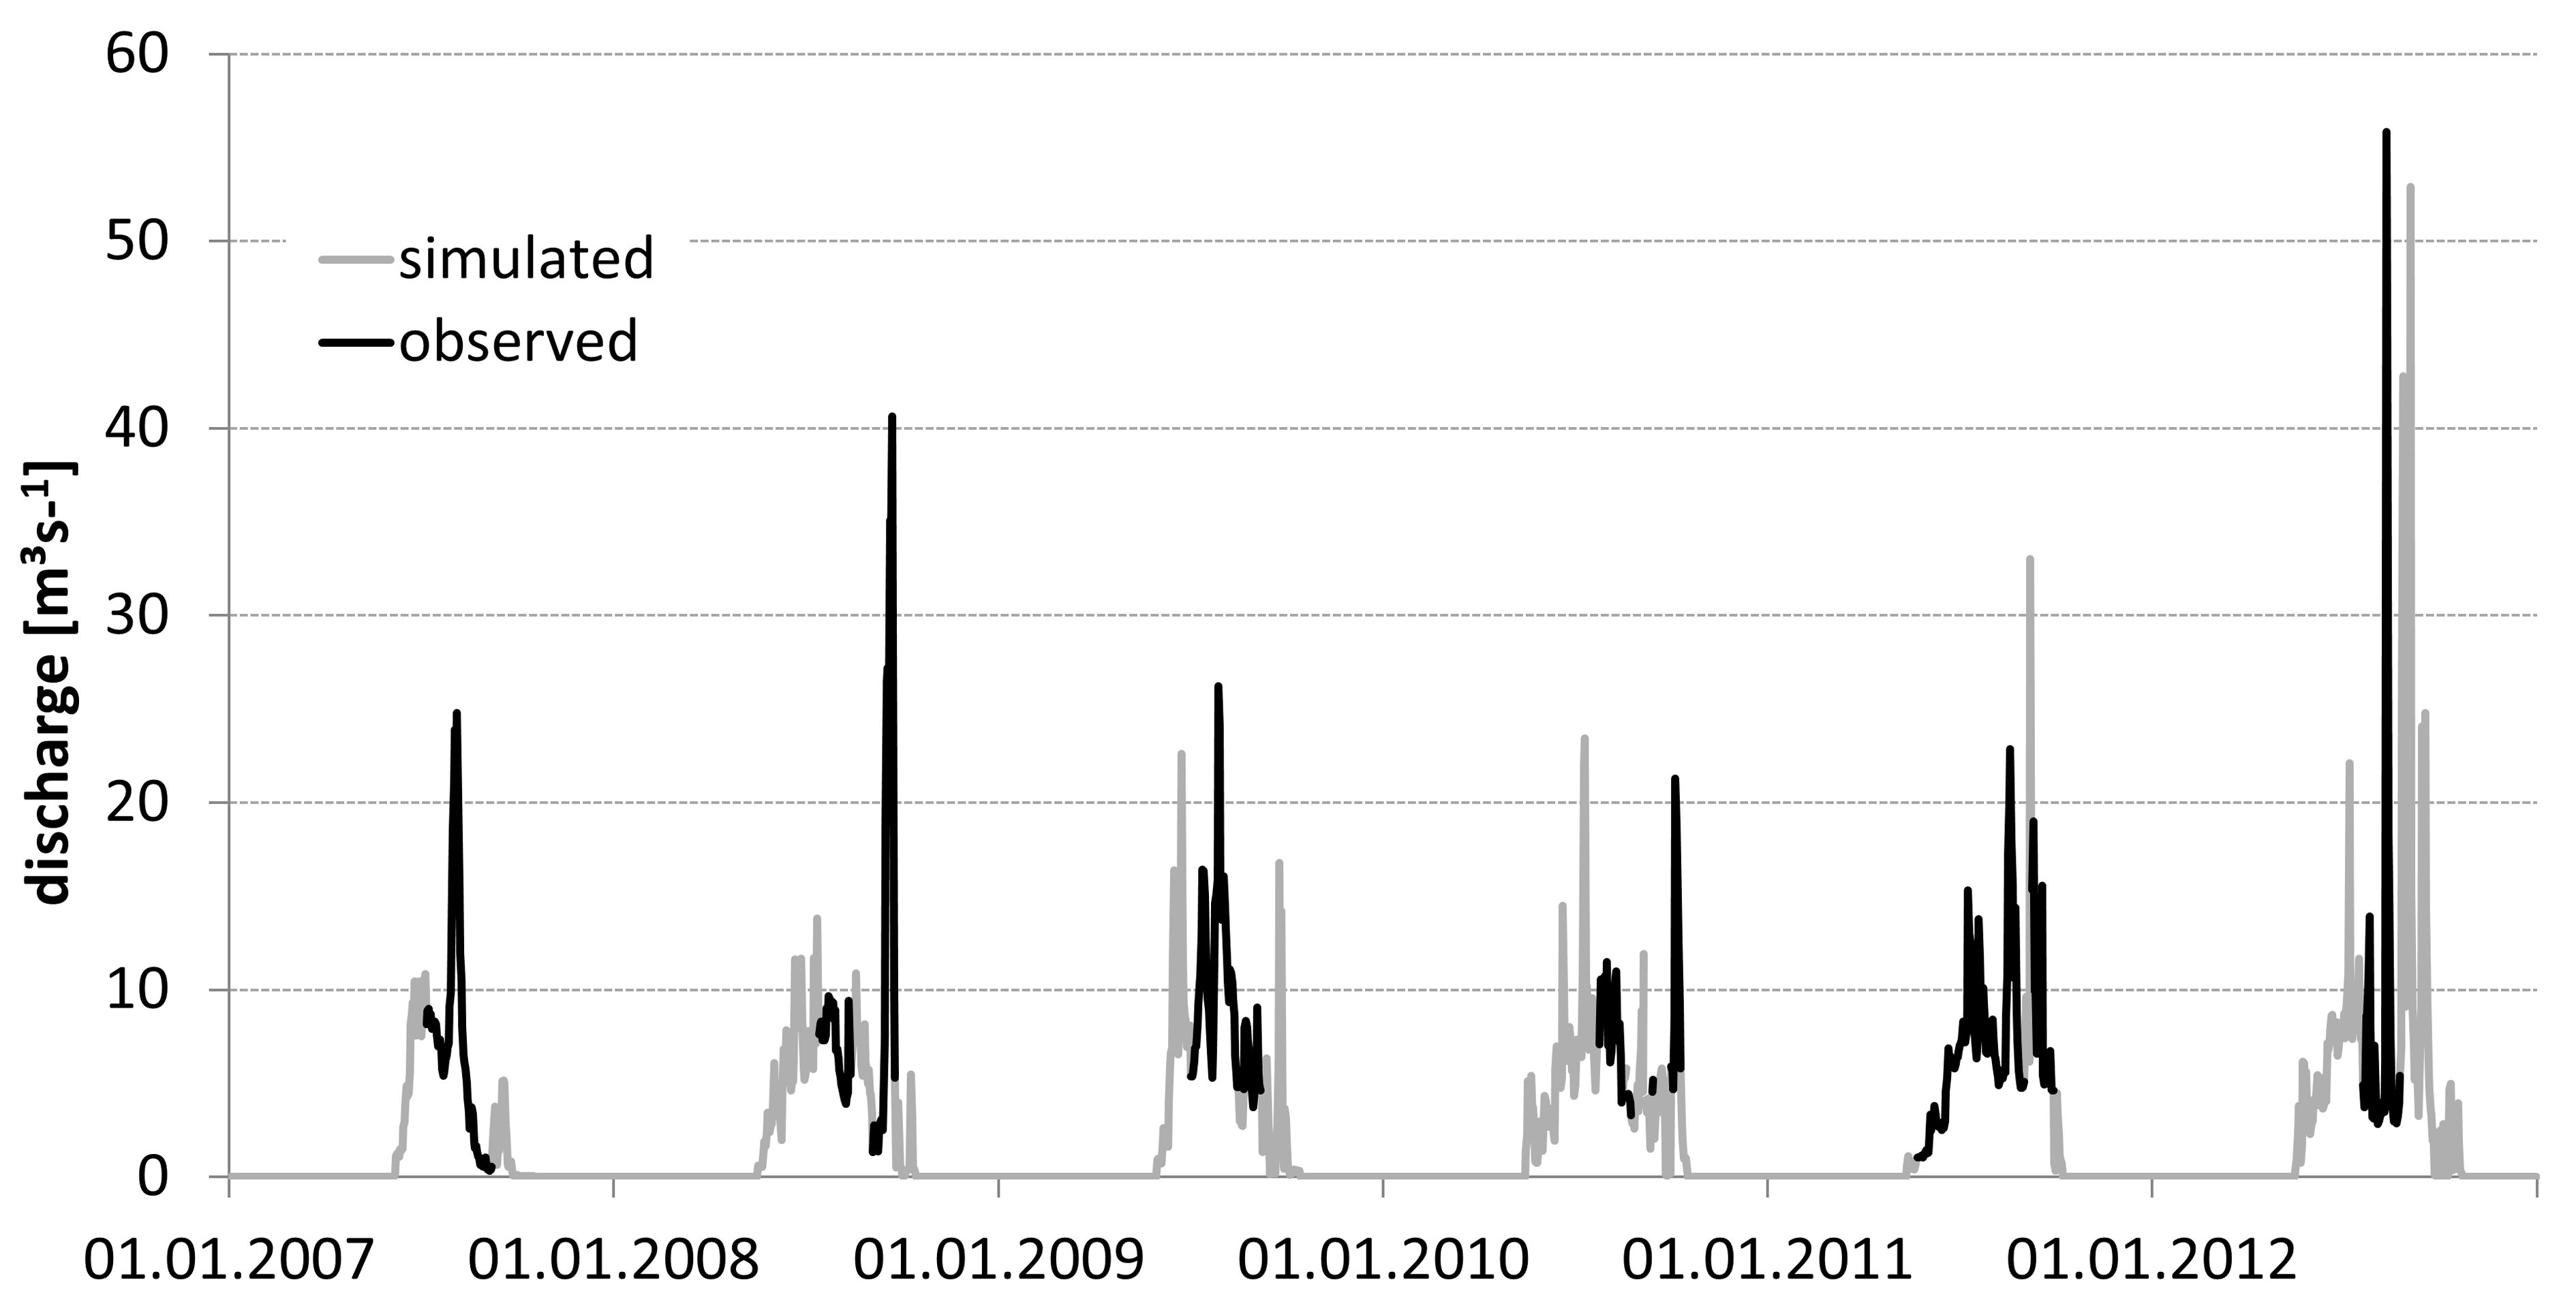
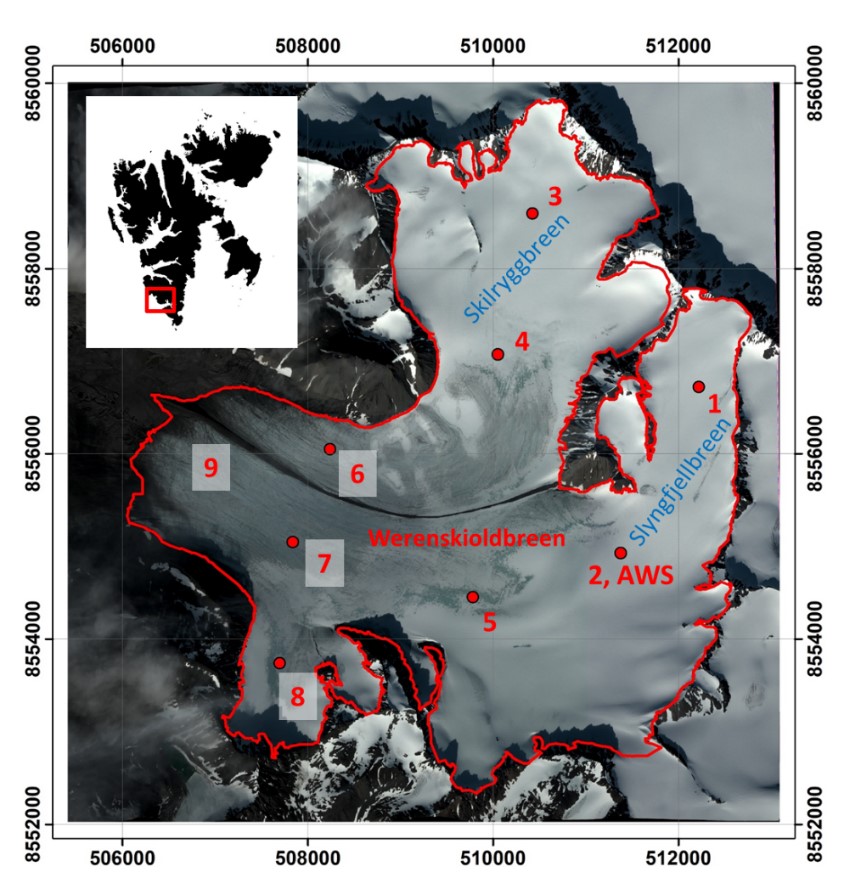
• Discharge measurements were conducted from May/June/July to September/October in the years 2007–2012. Direct observation periods were 62, 51, 61, 40, 121, and 35 days in the consecutive years. The data set was obtained from CTD-DIVER DI 261 or Mini-Diver (Van Essen Instruments, Delft, The Netherlands) logger with barometric compensation by BaroDiver (Schlumberger, Houston, TX, USA) with 10-min intervals and flow velocities were measured with a SEBA F1 current meter (SEBA Hydrometrie GmbH, Kaufbeuren, Germany). Mean daily discharge and total runoff in the hydrologically active season was calculated on the basis of the 24h running average of the water level and a rating curve (Appendix 1). More details have been reported by Majchrowska E., Ignatiuk D., Jania J., Marszałek H., Wąsik M., 2015: Seasonal and interannual variability in runoff from the Werenskioldbreen catchment, Spitsbergen. Polish Polar Research vol. 36, no. 3, pp. 197–224. doi: 10.1515/popore−2015−0014 • Hydrological data for Werenskioldbreen - archive of the University of Silesia. The base contain mean daily discharge in the years: 1972, 1973, 1974, 1979, 1980, 1983, 1985, 1986, 1988, 1998, 2007, 2008, 2009, 2010, 2011, 2012, 2013, 2017 (18 hydrologically active seasons) – Appendix 2
-
The dataset includes point winter and summer mass balance measurements on ablation stakes in 2009-2020 and the calculated point annual mass balance. The dataset includes part of the results from the project “Hindcasting and projections of hydro-climatic conditions of Southern 350 Spitsbergen” (grant no. 2017/27/B/ST10/01269) financed by the Polish National Science Centre, “Arctic climate system study of ocean, sea ice, and glaciers interactions in Svalbard area”—AWAKE2 (Pol-Nor/198675/ 17/2013), supported by the National Centre for Research and Development within the Polish–Norwegian Research Cooperation Programme and the SvalGlac—Sensitivity of Svalbard glaciers to climate change, the ESF Project, the project Integrated Arctic 355 Observing System (INTAROS)- Horizon 2020, the ice2sea 7th FP projects. The studies were carried out as part of the scientific activity of the Centre for Polar Studies (University of Silesia in Katowice) with the use of research and logistic equipment of the Polar Laboratory of the University of Silesia in Katowice.
-
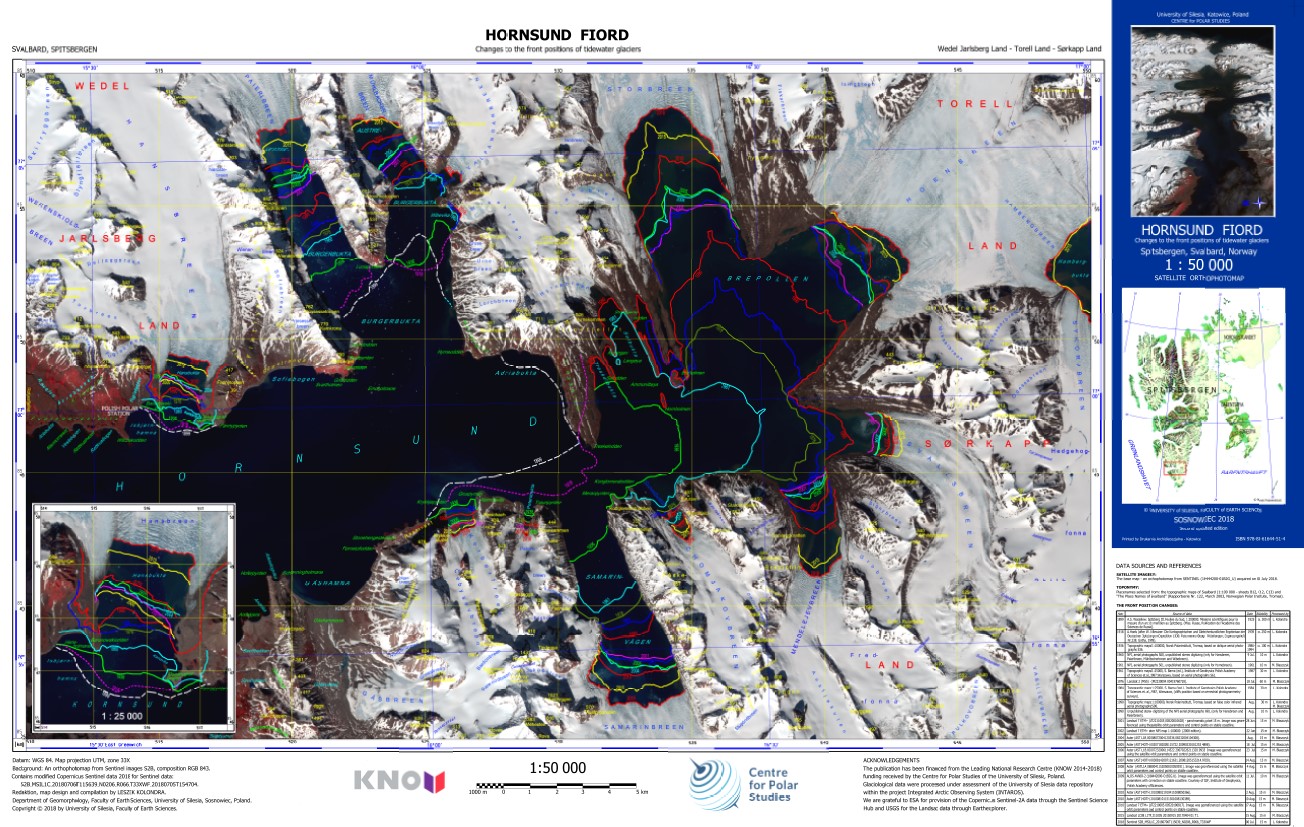
The ortophotomap of Hornsund Fiord with changes to the front positions of tidewater glaciers. The front positions are based on different cartographical maps and satellite data. The base map is Sentinel 2 satellite image acquired on 6 July 2018. Citation: Kolondra L., 2018. Hornsund Fiord - Changes to the front positions of tidewater glaciers. University of Silesia, Faculty of Earth Sciences.
-
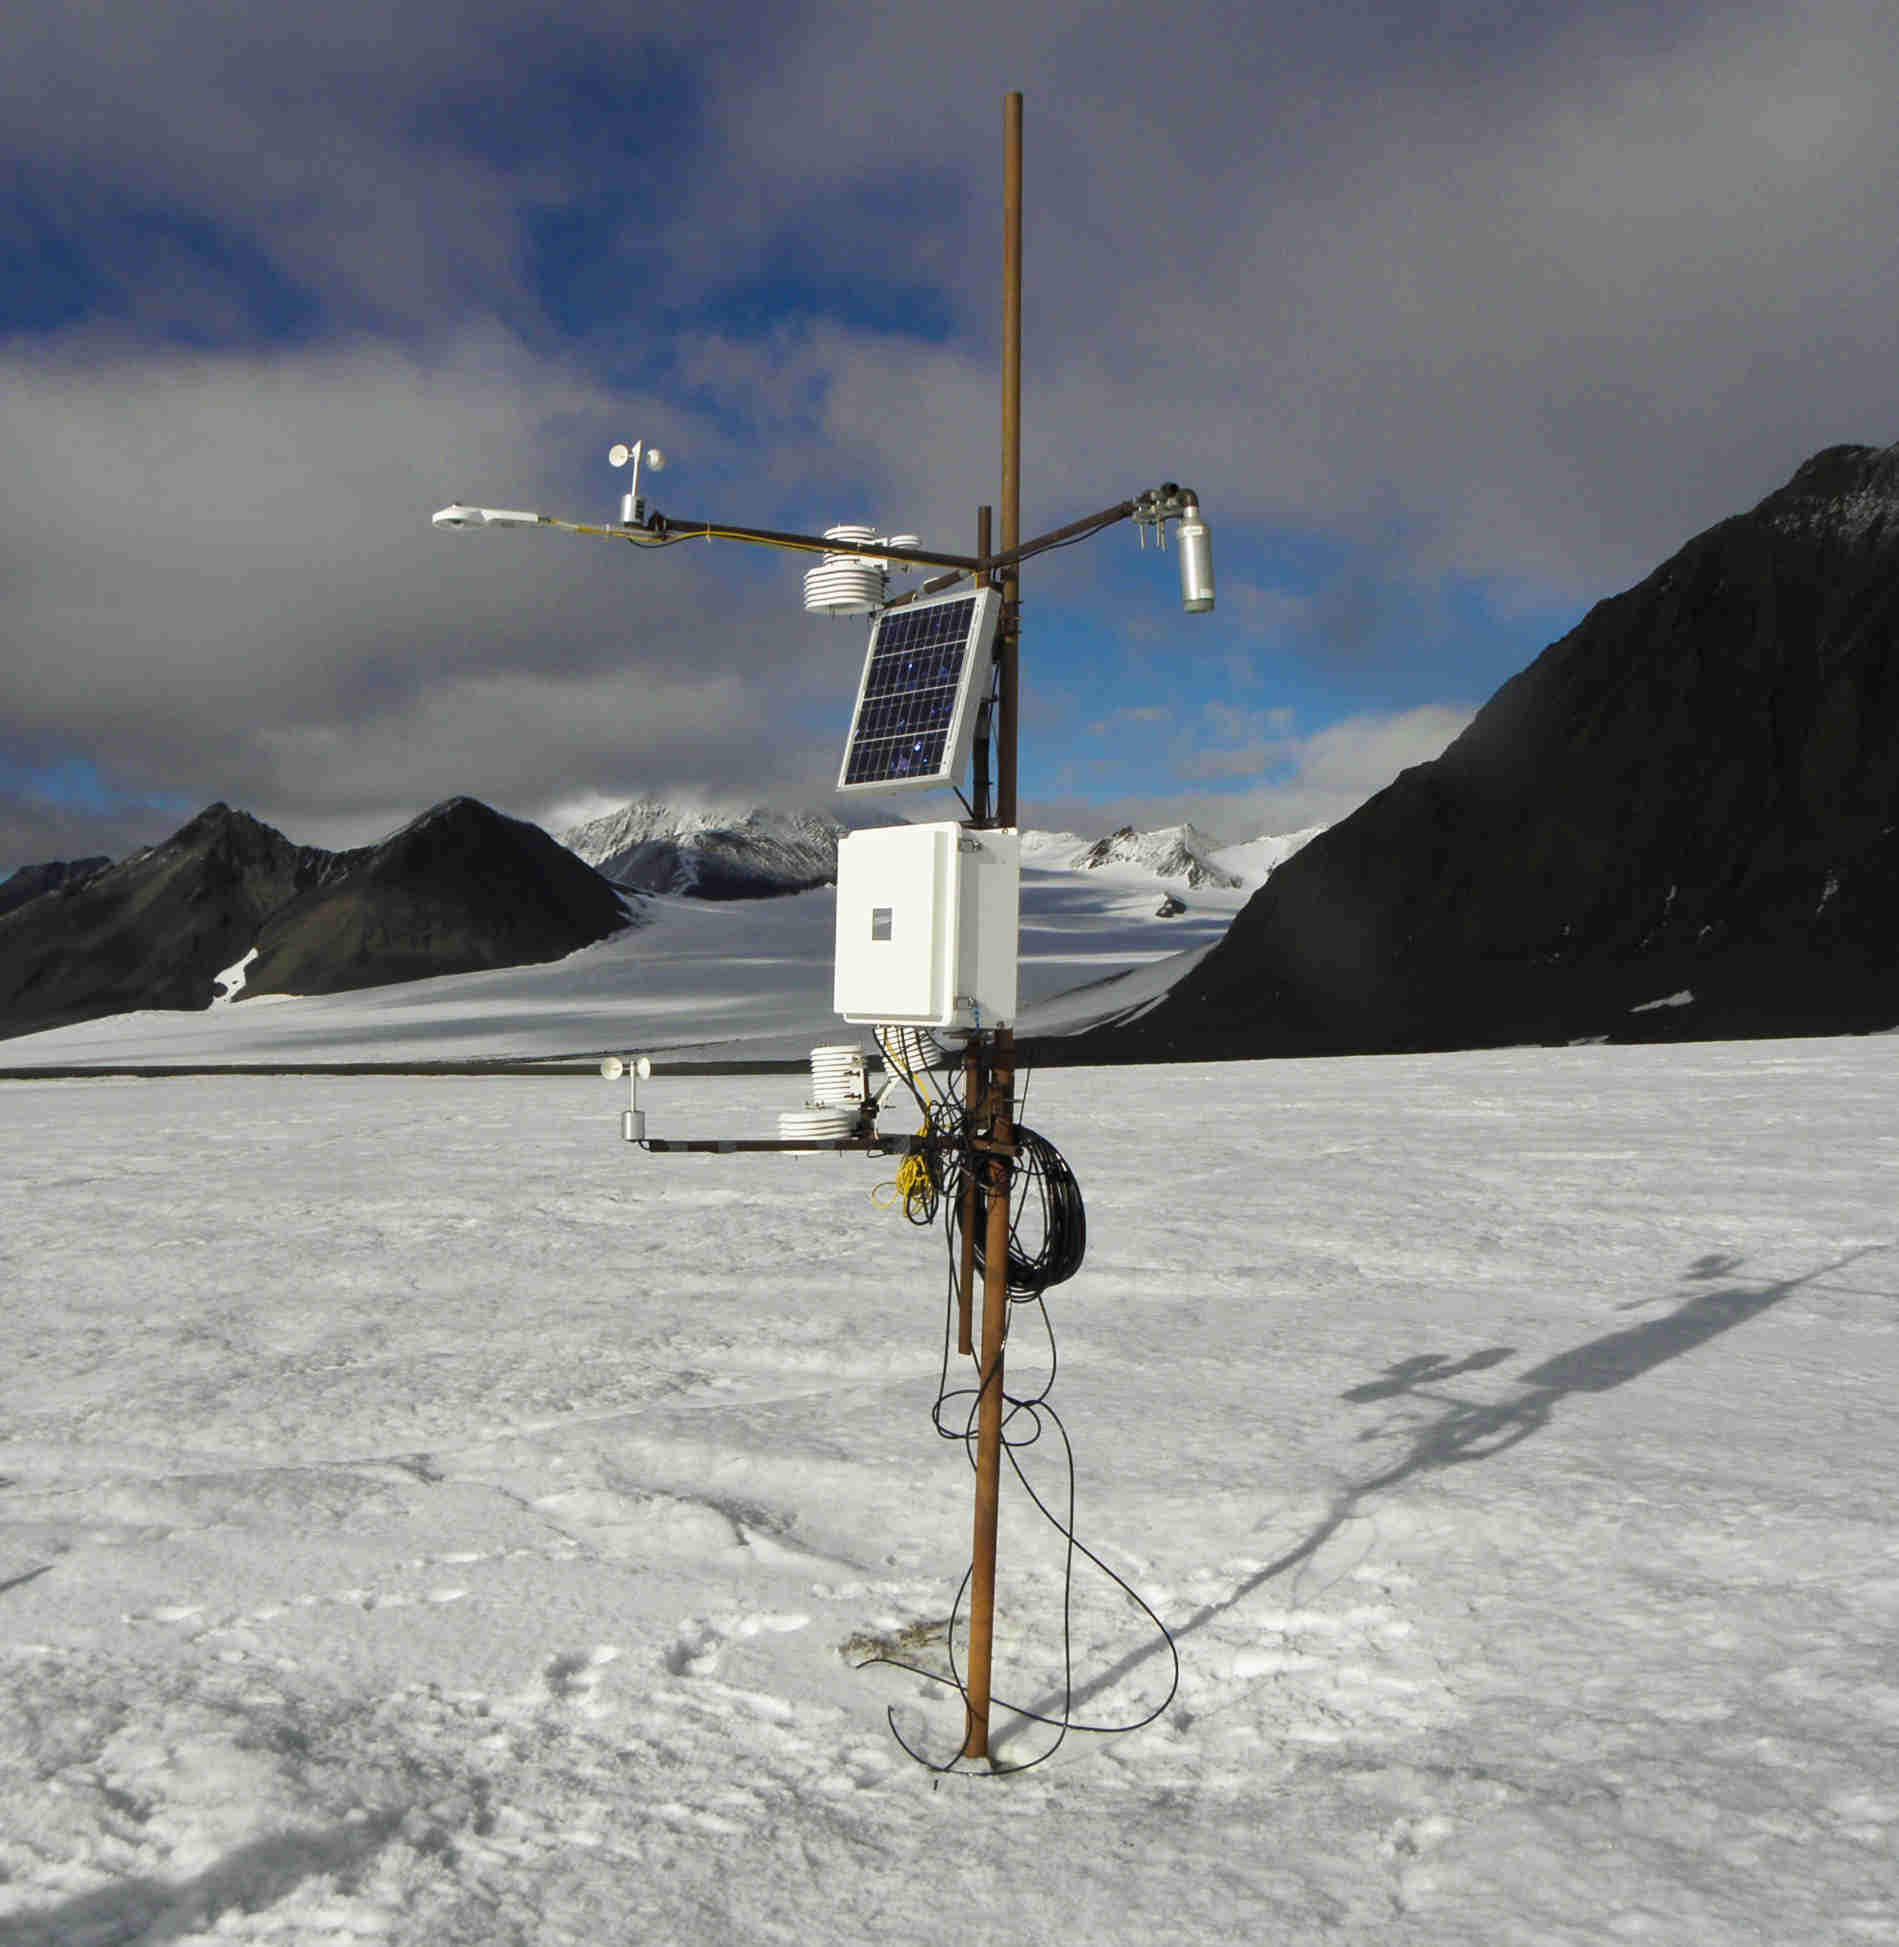
Air temperature measurements from AWS located on the Werenskioldbreen. The sensors are installed on a mast that is mounted in the glacier ice. During the season, the distance between the glacier's surface and the sensors increases. The instruments are serviced at least once a year between March and April.
-
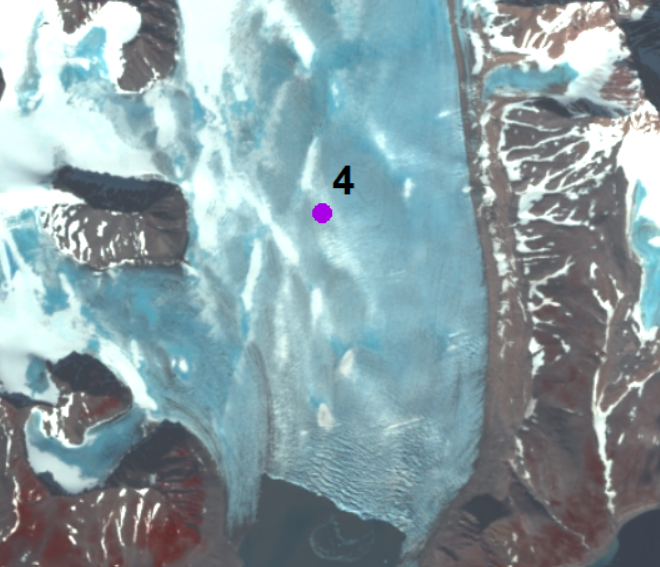
The annual velocity of Hansbreen in the period 2007–2015 is determined at stake No. 4 located approximately 3.5 km upstream of the glacier terminus (15°28`E, 77°02`N). Monitoring of the glacier is conducted by Institute of Geophysics Polish Academy of Science. The stake position was measured by the differential GPS receiver at the turn of each year (December/January) (with a horizontal accuracy of ±4 cm). Velocity along the Hansbreen terminus in 2009 and 2015 is processed from repeated terrestrial laser scanning in August 2009 and August 2015. Values of displacements of the same features along the calving front (distinctive edges of crevasses) for approximately two weeks were provided with an accuracy of around 10 cm. The database is the supplement to the paper: Małgorzata Błaszczyk, Jacek A. Jania, Michał Ciepły, Mariusz Grabiec, Dariusz Ignatiuk, Leszek Kolondra, Aleksandra Kruss, Bartłomiej Luks, Mateusz Moskalik, Tadeusz Pastusiak, Agnieszka Strzelewicz, Waldemar Walczowski, Tomasz Wawrzyniak. “Factors controlling terminus position of Hansbreen, a tidewater glacier in Svalbard”, Journal of Geophysical Research - Earth Surface, https://doi.org/10.1029/2020JF005763.
-
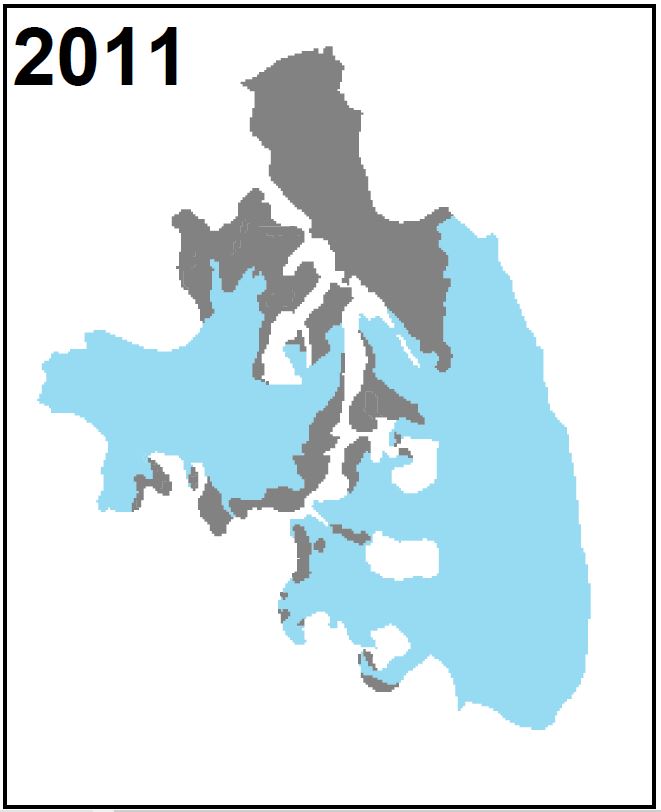
Firn extents of Hansbreen and Werenskoildbreen delivered from unsupervised classifications of single, dual and fully-polarimetric SAR data (ALOS-2 PALSAR, RADARSAT-2, Sentinel-1, ERS-2 SAR) between 2011 and 2017. Methods of classification: unsupervised ISO classification, H-a Wishart Classification. Results validated with terrestrial measurements (shallow ice cores drilling, Ground Penetrating Radar measurements). Research supported by the European Space Agency, Third Party Missions grant and Svalbard Science Forum, Arctic Field Grant 2018. For more details, please e-mail to this adress: bbarzycka@us.edu.pl.
-
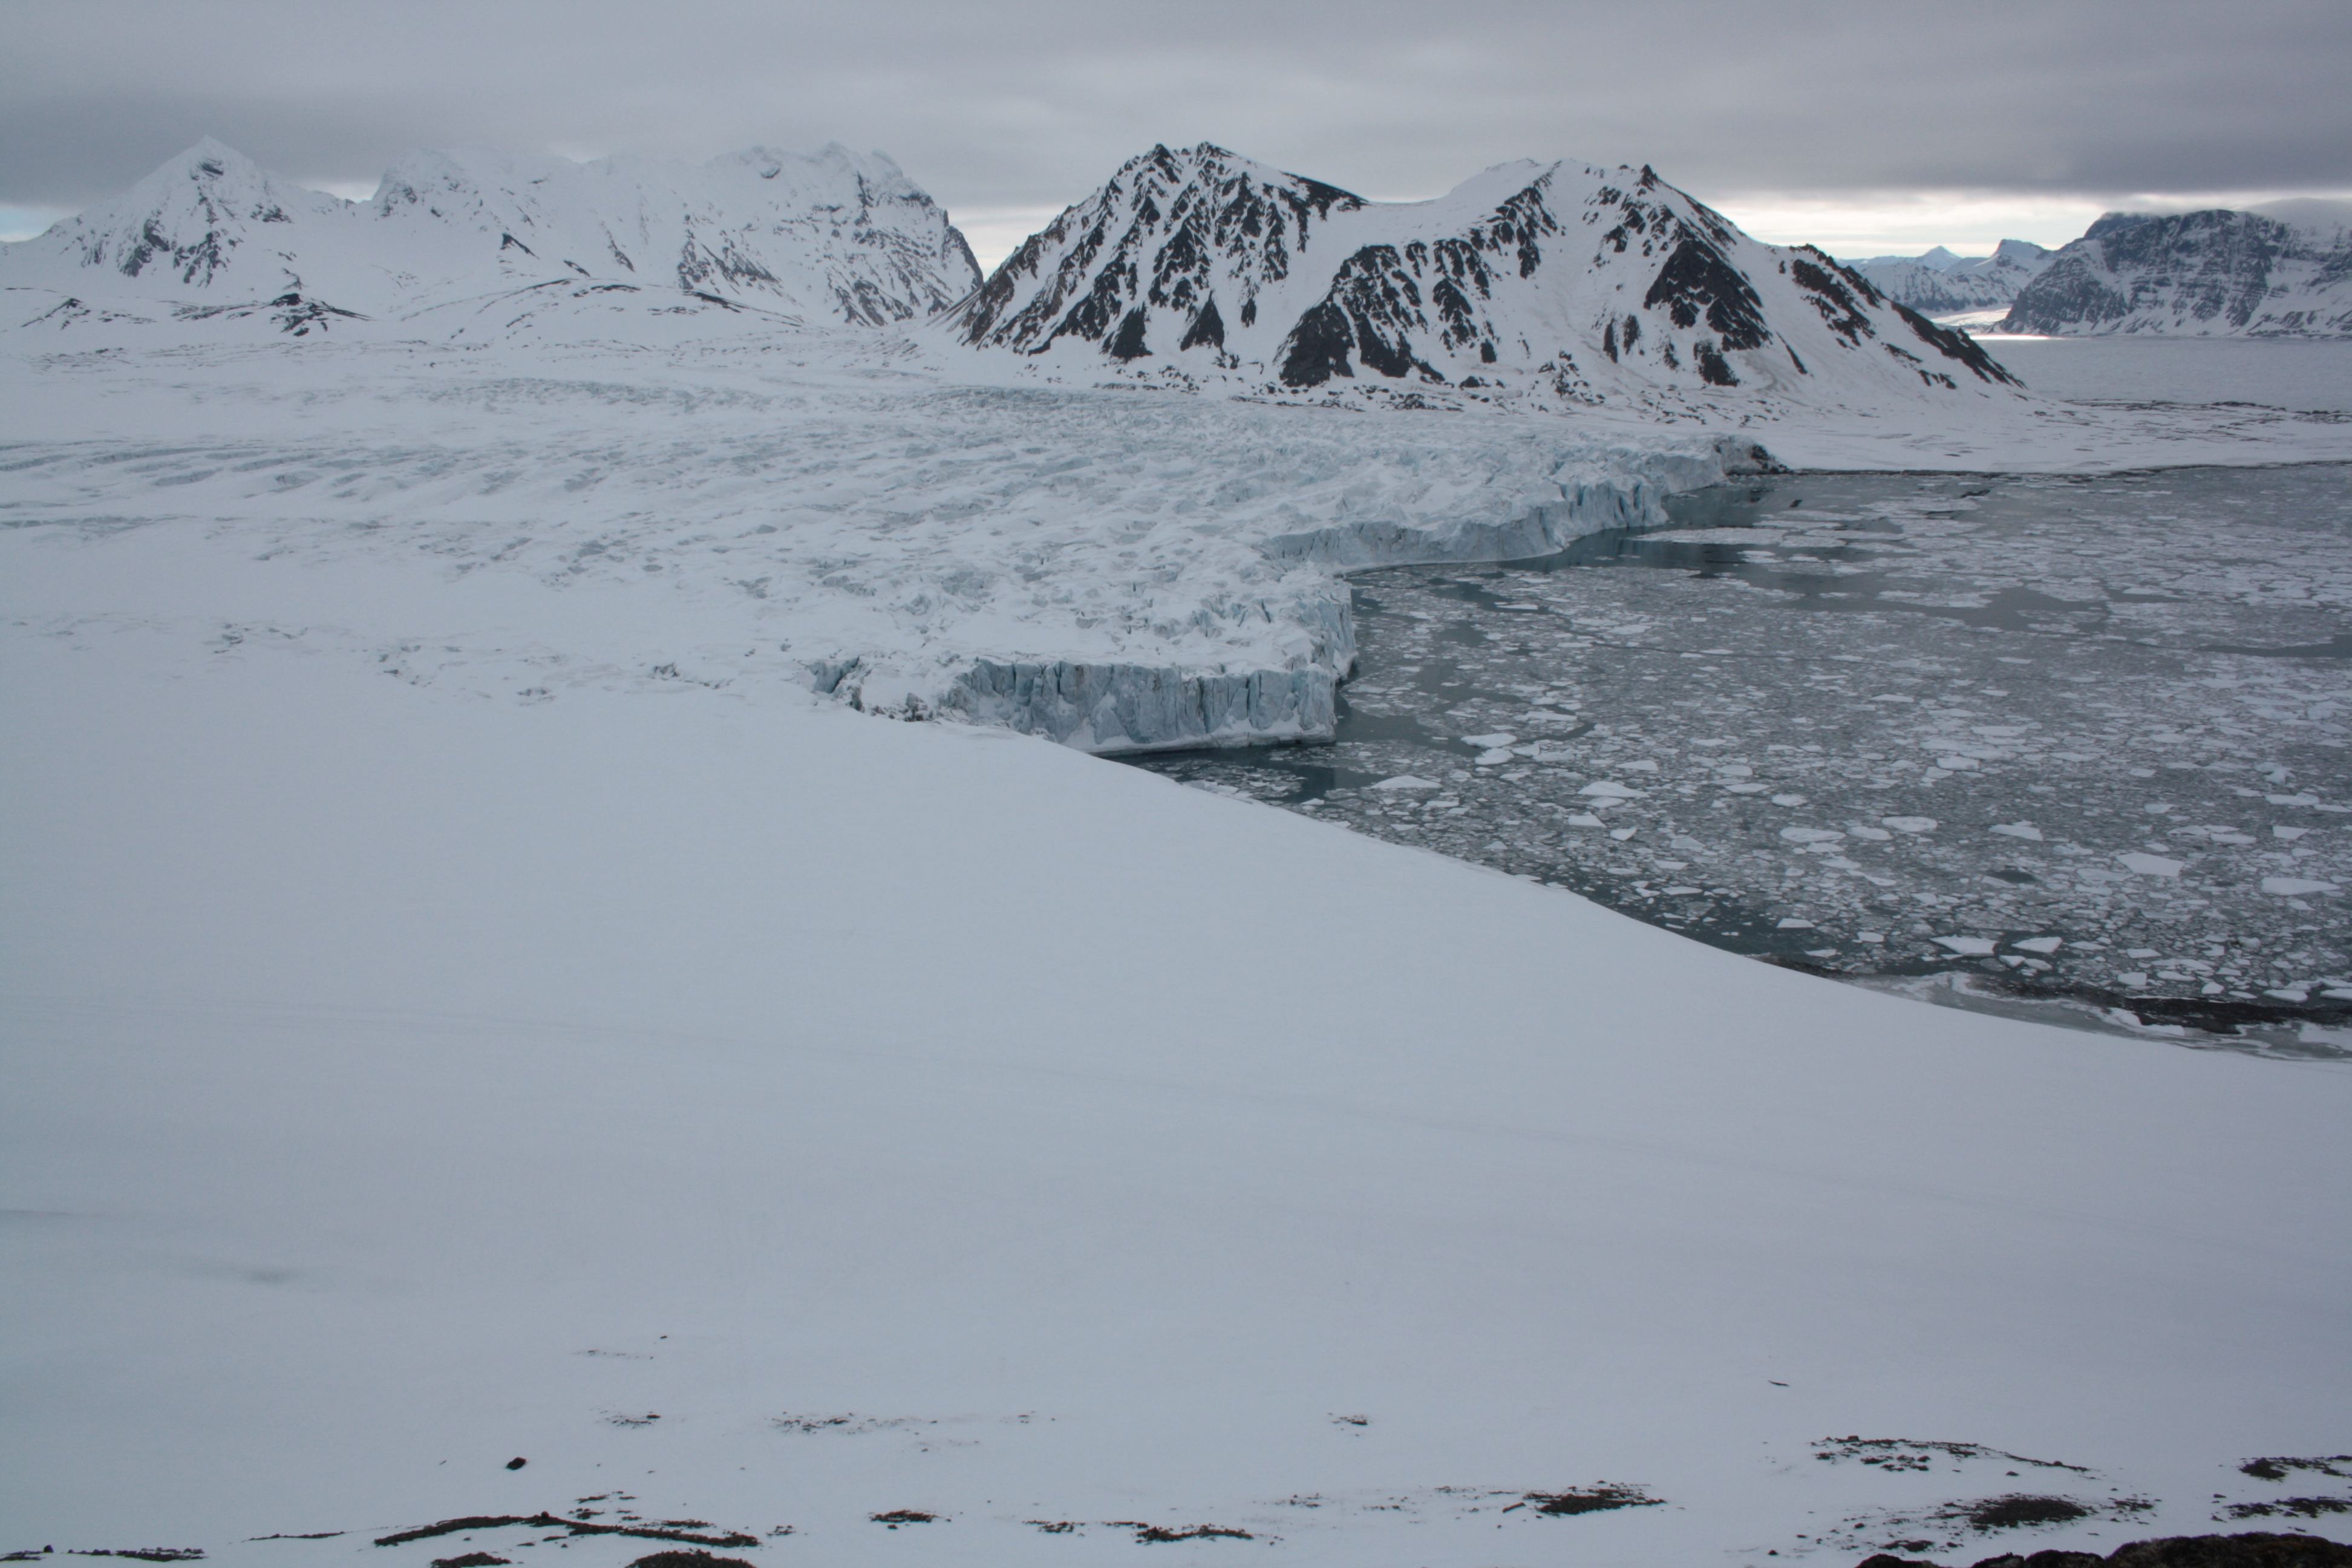
Meteorological data from Aavatsmark Glacier (Aavatsmarkbreen)
-
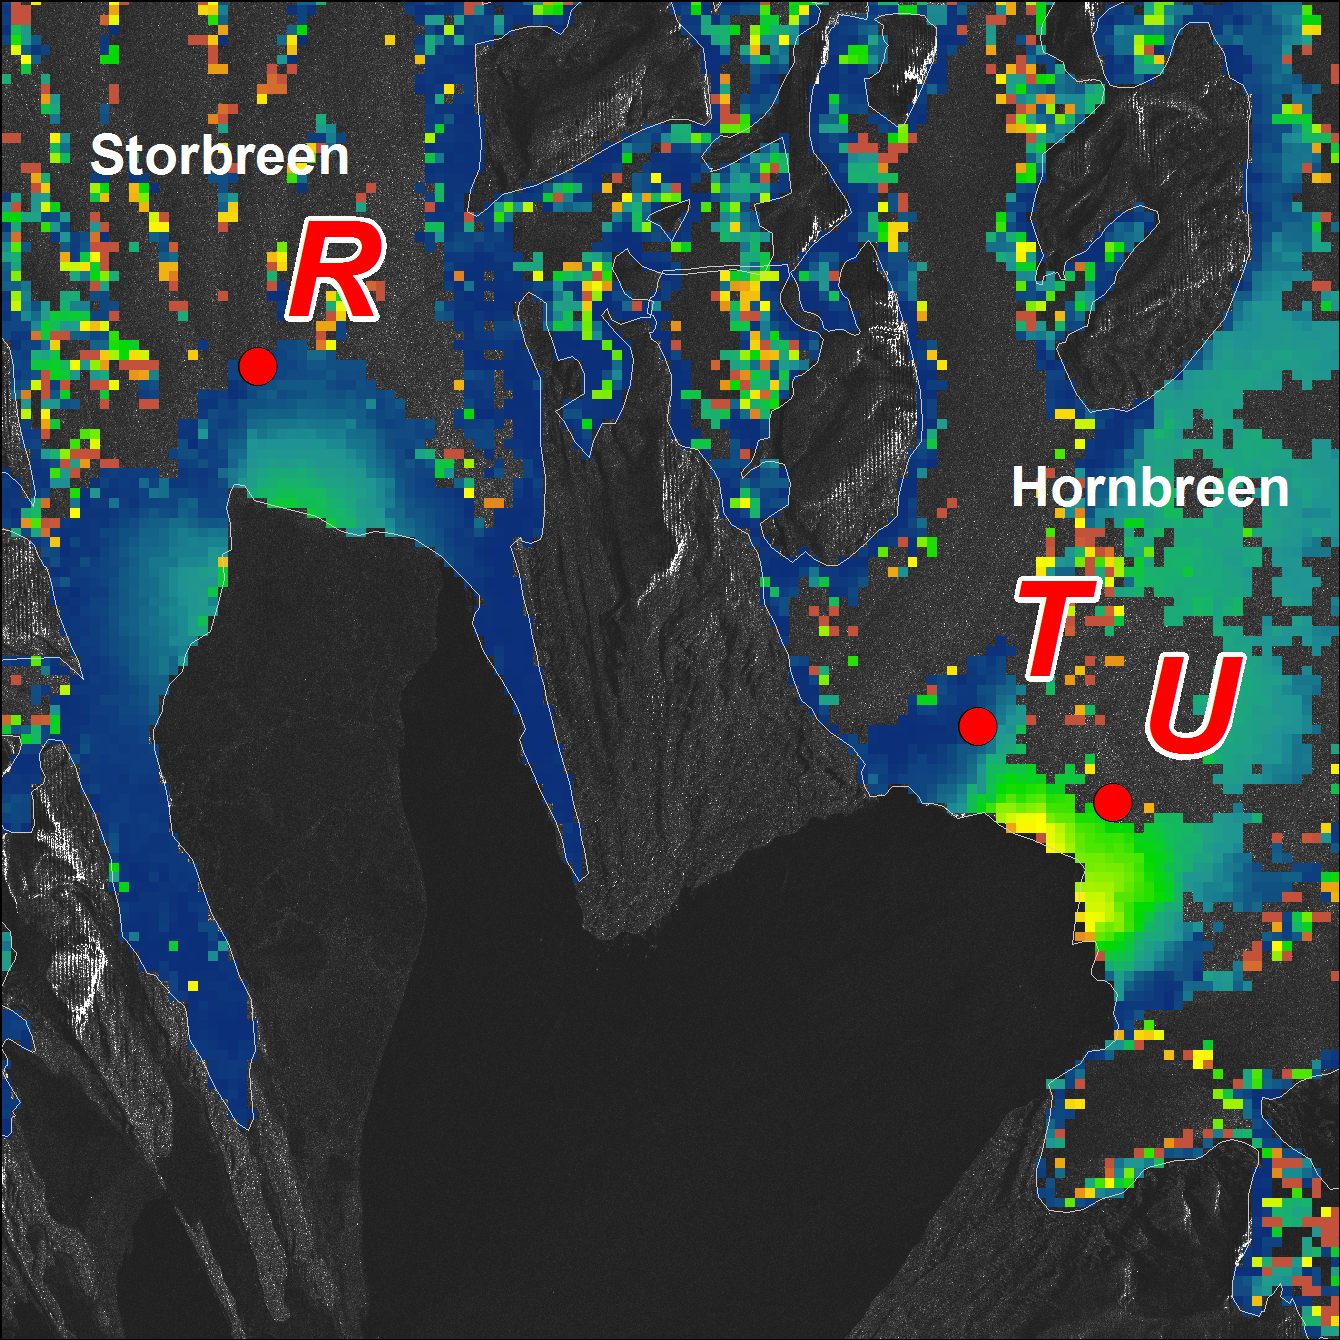
Glacier velocities are derived from the displacements of four stakes (Z, R, T, U) installed close to the front of three glaciers in Hornsund. Measurements of stakes position were conducted in 2013-2015, with precise dGPS receiver (Leica 1230, accuracy ±5cm) and single-frequency GPS receiver (Garmin, accuracy ±5m). Detailed description of the source data and accuracy can be found in: Błaszczyk M., Ignatiuk D., Uszczyk A., Cielecka-Nowak K., Grabiec M., Jania J., Moskalik M., Walczowski W., 2019. Freshwater input to the Arctic fjord Hornsund (Svalbard). Polar Research, 38. https://doi.org/10.33265/polar.v38.3506
-
Ice condition directly at the Hansbreen front is obtained from visual interpretation of oblique pictures taken at 3 h intervals by Canon EOS 1000D time-lapse photography (Figure 1) for the period 2010–2015 (https://ppdb.us.edu.pl/geonetwork/srv/pol/catalog.search;jsessionid=muhaqbum8pz21xknjo0crhodn?node=srv#/metadata/cf6a17fd-ec3a-4ff6-8232-67a0dc5957d4) The database is the supplement to the paper: Małgorzata Błaszczyk, Jacek A. Jania, Michał Ciepły, Mariusz Grabiec, Dariusz Ignatiuk, Leszek Kolondra, Aleksandra Kruss, Bartłomiej Luks, Mateusz Moskalik, Tadeusz Pastusiak, Agnieszka Strzelewicz, Waldemar Walczowski, Tomasz Wawrzyniak. “Factors controlling terminus position of Hansbreen, a tidewater glacier in Svalbard”, Journal of Geophysical Research - Earth Surface, https://doi.org/10.1029/2020JF005763.
-
Dataset contains snowpack density derived from shallow snow cores. Fieldwork has been done during peak of accumulation on several glaciers in the region of Hornsund, Svalbard: Amundsenisen (2013) Werenskioldbreen (2013, 2015) Nannbreen (2013) Flatbreen (2013, 2018) Storbreen (2013, 2018) Results might be valuable i.a. for mass-balance estimations or GPR survey validation. Acknowledgements: Research Council of Norway, Arctic Field Grant 2013: Spatial distribution of snow cover and drainage systems on the glaciers on Wedel Jarlsberg Land (RiS ID: 6158); the National Science Centre PRELUDIUM 4: Role of meltwater from snow cover for supplying drainage systems of the Spitsbergen glaciers (2012/07/N/ST10/03784); Citation: LASKA M.,GRABIEC M.,IGNATIUK D.,BUDZIK T.,2017. Snow deposition patterns on southern Spitsbergen glaciers, Svalbard, in relation to recent meteorological conditions and local topography. Geografiska Annaler, Series A: Physical Geography, 99(3): 262–287. doi:10.1080/04353676.2017.1327321