 Centre for Polar Studies
Hansbreen, Svalbard, Arctic
Type of resources
Topics
Keywords
Contact for the resource
Provided by
Representation types
Update frequencies
status
-
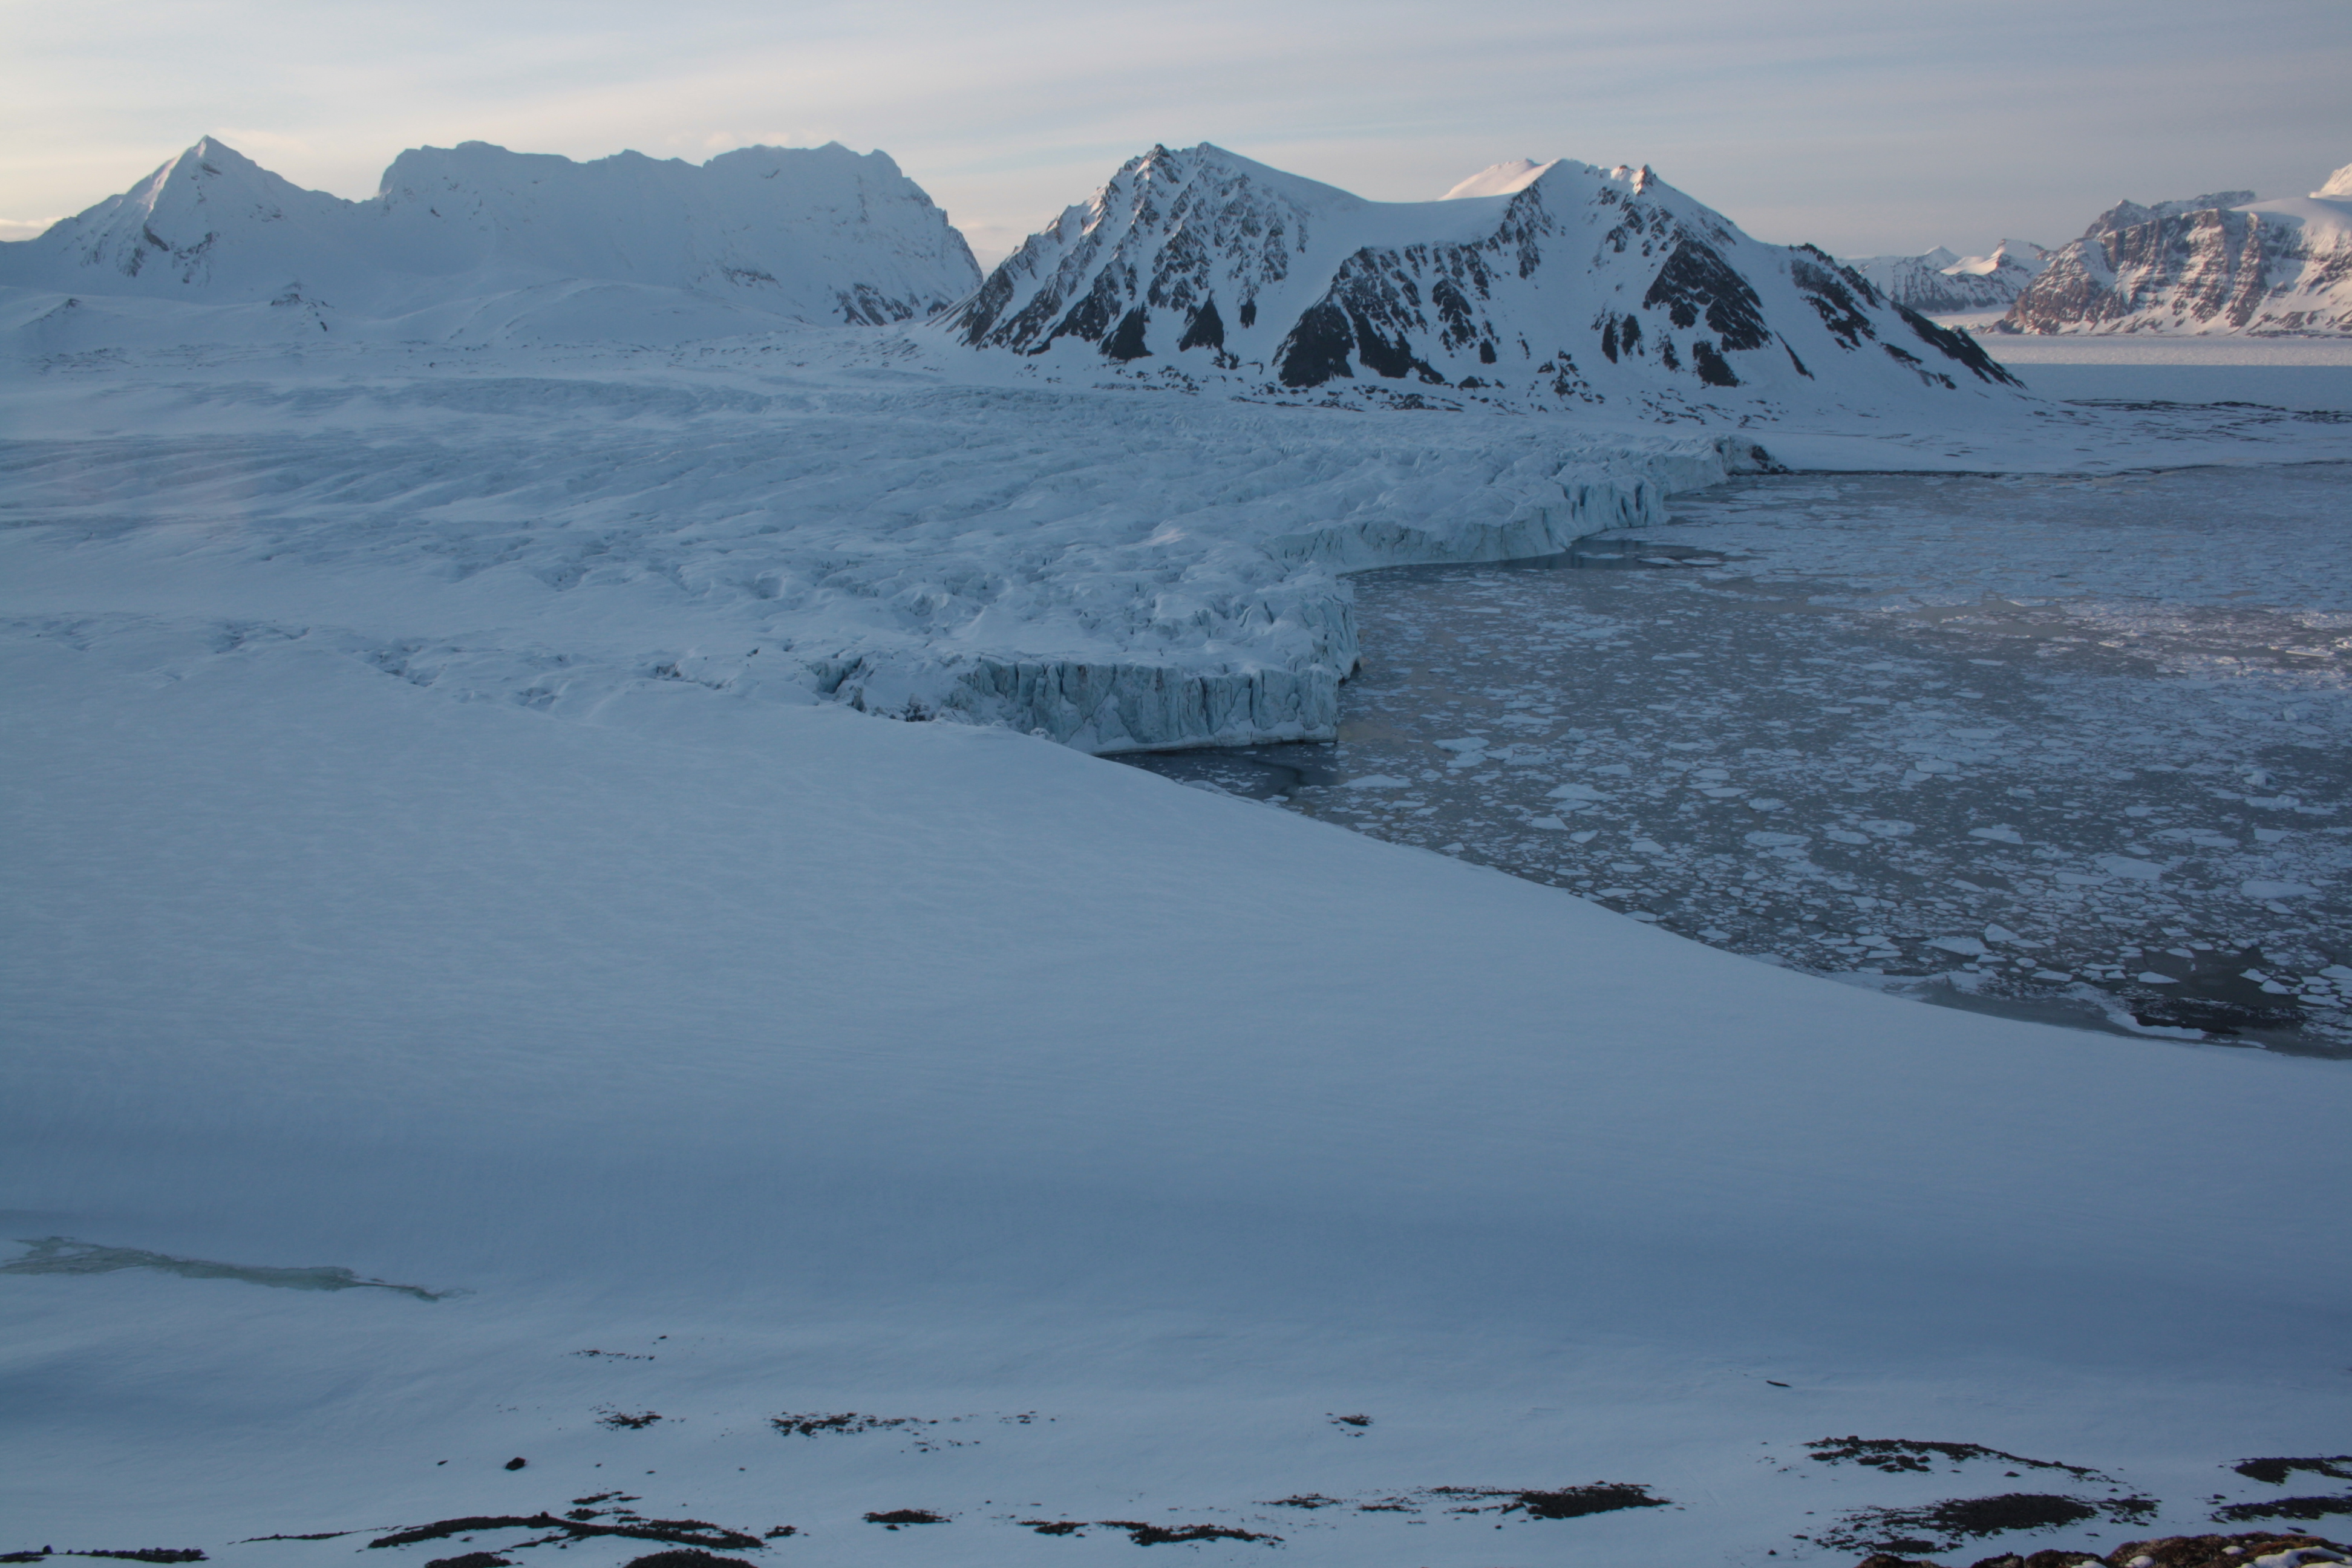
Since 2010, continuous monitoring of the front zone of the Hansa Glacier with the use of Canon Eos 1000D photo cameras has been carried out (timelapse). Pictures in different periods of time were taken by 3 different cameras. Two cameras (106 and 107) were located on the Fugleberget slope and one (601) on the Baranowskiodden. The periods for which data are available and the interval of taking pictures are shown in Appendix 1.
-
The files in this daaset include: (1) AEV_FGPR.txt - time series of normalised absolute extreme values (AEV) calculated from the 21 traces of the GPR profiles, determined in accordance with the procedure described in Grabiec:'Field and Simulated Ground Penetrating Radar (GPR) Data for Improved Snow Structure Analysis on Arctic Glacier'section 3.3. Input GPR signal amplitude sequences equal to 50 ns were analysed for the moment of the first significant waveform amplitude drift from values close to 0, which was given the value TWTT=0 ns. This moment was individual for each profile. The elimination of the pre-existing data resulted in the strings being shorter than the originals and of different lengths. In the case of the GPR profiles 2011_hansIIItest4 and 2011_hans3test5, they were taken at TW<50 ns and their length was not changed. Values are given as averages for segments equal to 1 ns. Hence, e.g. 1 AEV related to TWTT=1 means AEV_FGPR values averaged over the range 1 - 1.999 ns. AEV values for the range 0 - 1 ns have been omitted from the series, as in most cases no local maximum of the signal amplitude value has been recorded in this range. (2) AEV_SGPR.txt - time series of normalised absolute extreme values (AEV) calculated from the synthetic signal obtained in the gprMAX software and further processed according to the procedure described in the Grabiec:'Field and Simulated Ground Penetrating Radar (GPR) Data for Improved Snow Structure Analysis on Arctic Glacier'section 3.3. For consistency of the time series, the TWTT length of AEV_SGPR was adjusted to that of AEV_FGPR. Values are given as averages for segments equal to 1 ns. Hence, e.g. 1 AEV related to TWTT=1 means AEV_SGPR values averaged over the range 1 - 1.999 ns. AEV values for the range 0 - 1 ns have been omitted from the series, as in most cases no local maximum of the signal amplitude value has been recorded in this range.
-
The data contains excerpts from GPR profiles located near snowpits performed on Hansbreen during the spring seasons of 2008, 2011, 2016, 2018, and 2019. (see Grabiec: ‘Synthetic and Actual GPR Data for Improved Snow Structure Analysis on Arctic Glacier’, Fig.1., Tab.1). The GPR profiles consist of 21 traces pre-trimmed to a time window TW=50 ns (TWTT). Profiles 2011_hansIIItest4 and 2011_hansIIItest5 were not pruned due to the original TW<50 ns. The files presented in the collection have not been further processed. A single GPR profile consists of a set of files with the same name and extension: .rad, .rd3, .utm (UTM coordinates), .rep, rad.vm (Mala Geoscience format)
-
TBD
-
TBD