 Centre for Polar Studies
irregular
Type of resources
Topics
Keywords
Contact for the resource
Provided by
Years
Representation types
Update frequencies
status
-
The database contains irregular meteorological data collected from the Hans Glacier (Hansbreen) in the years 2007-2017 as part of the polar expeditions of the University of Silesia in Spitsbergen / Svalbard. Data from three automatic weather stations. Measured elements: air temperature, air humidity, wind direction, wind speed, elements of radiation balance, others.
-
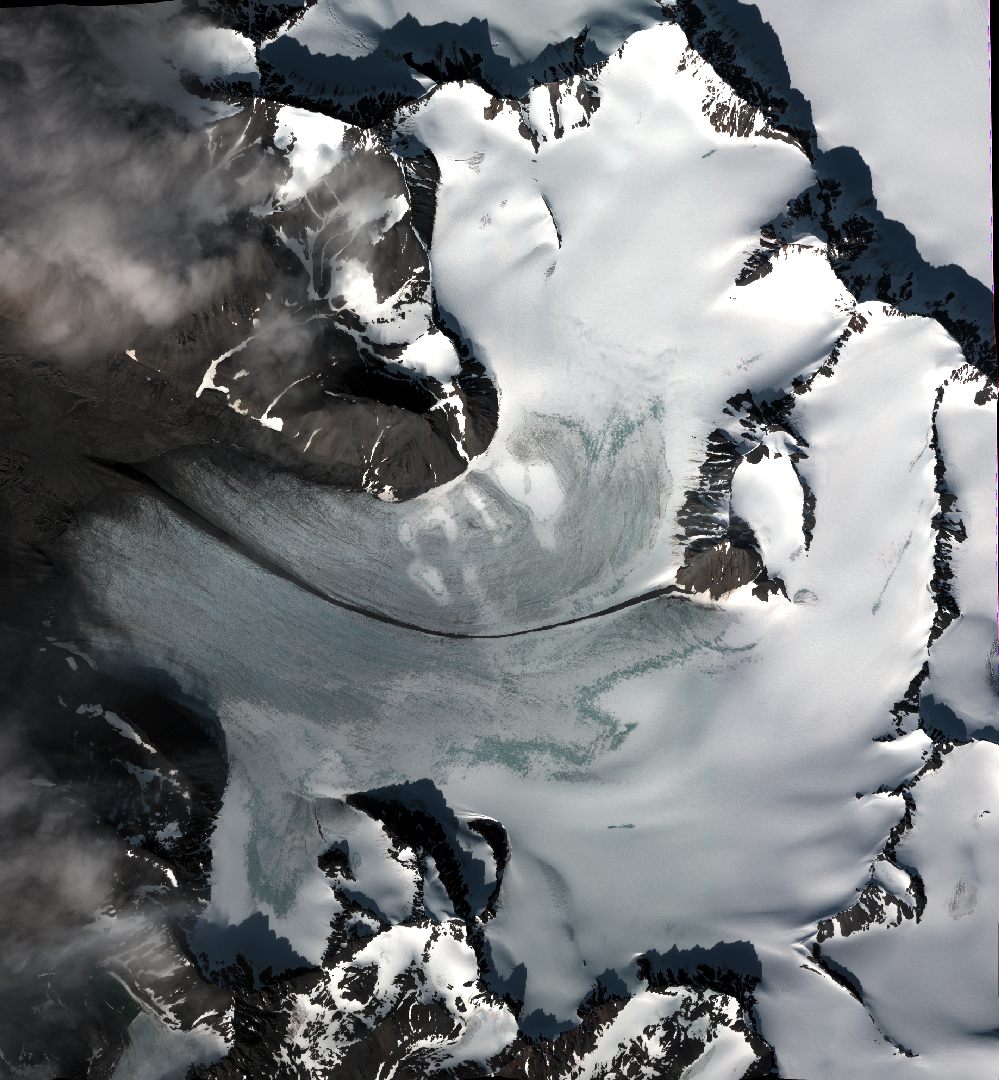
High resolution orthophoto images from Geoeye, WorldView-2 and Pléaides processed in OrthoEngine module of PCI Geomatica. Data format: grid, UTM 33X / EGM 2008. Spatial resolution: 0.5 m (panchromatic and pansharpened) and 2 m (multispectral).
-
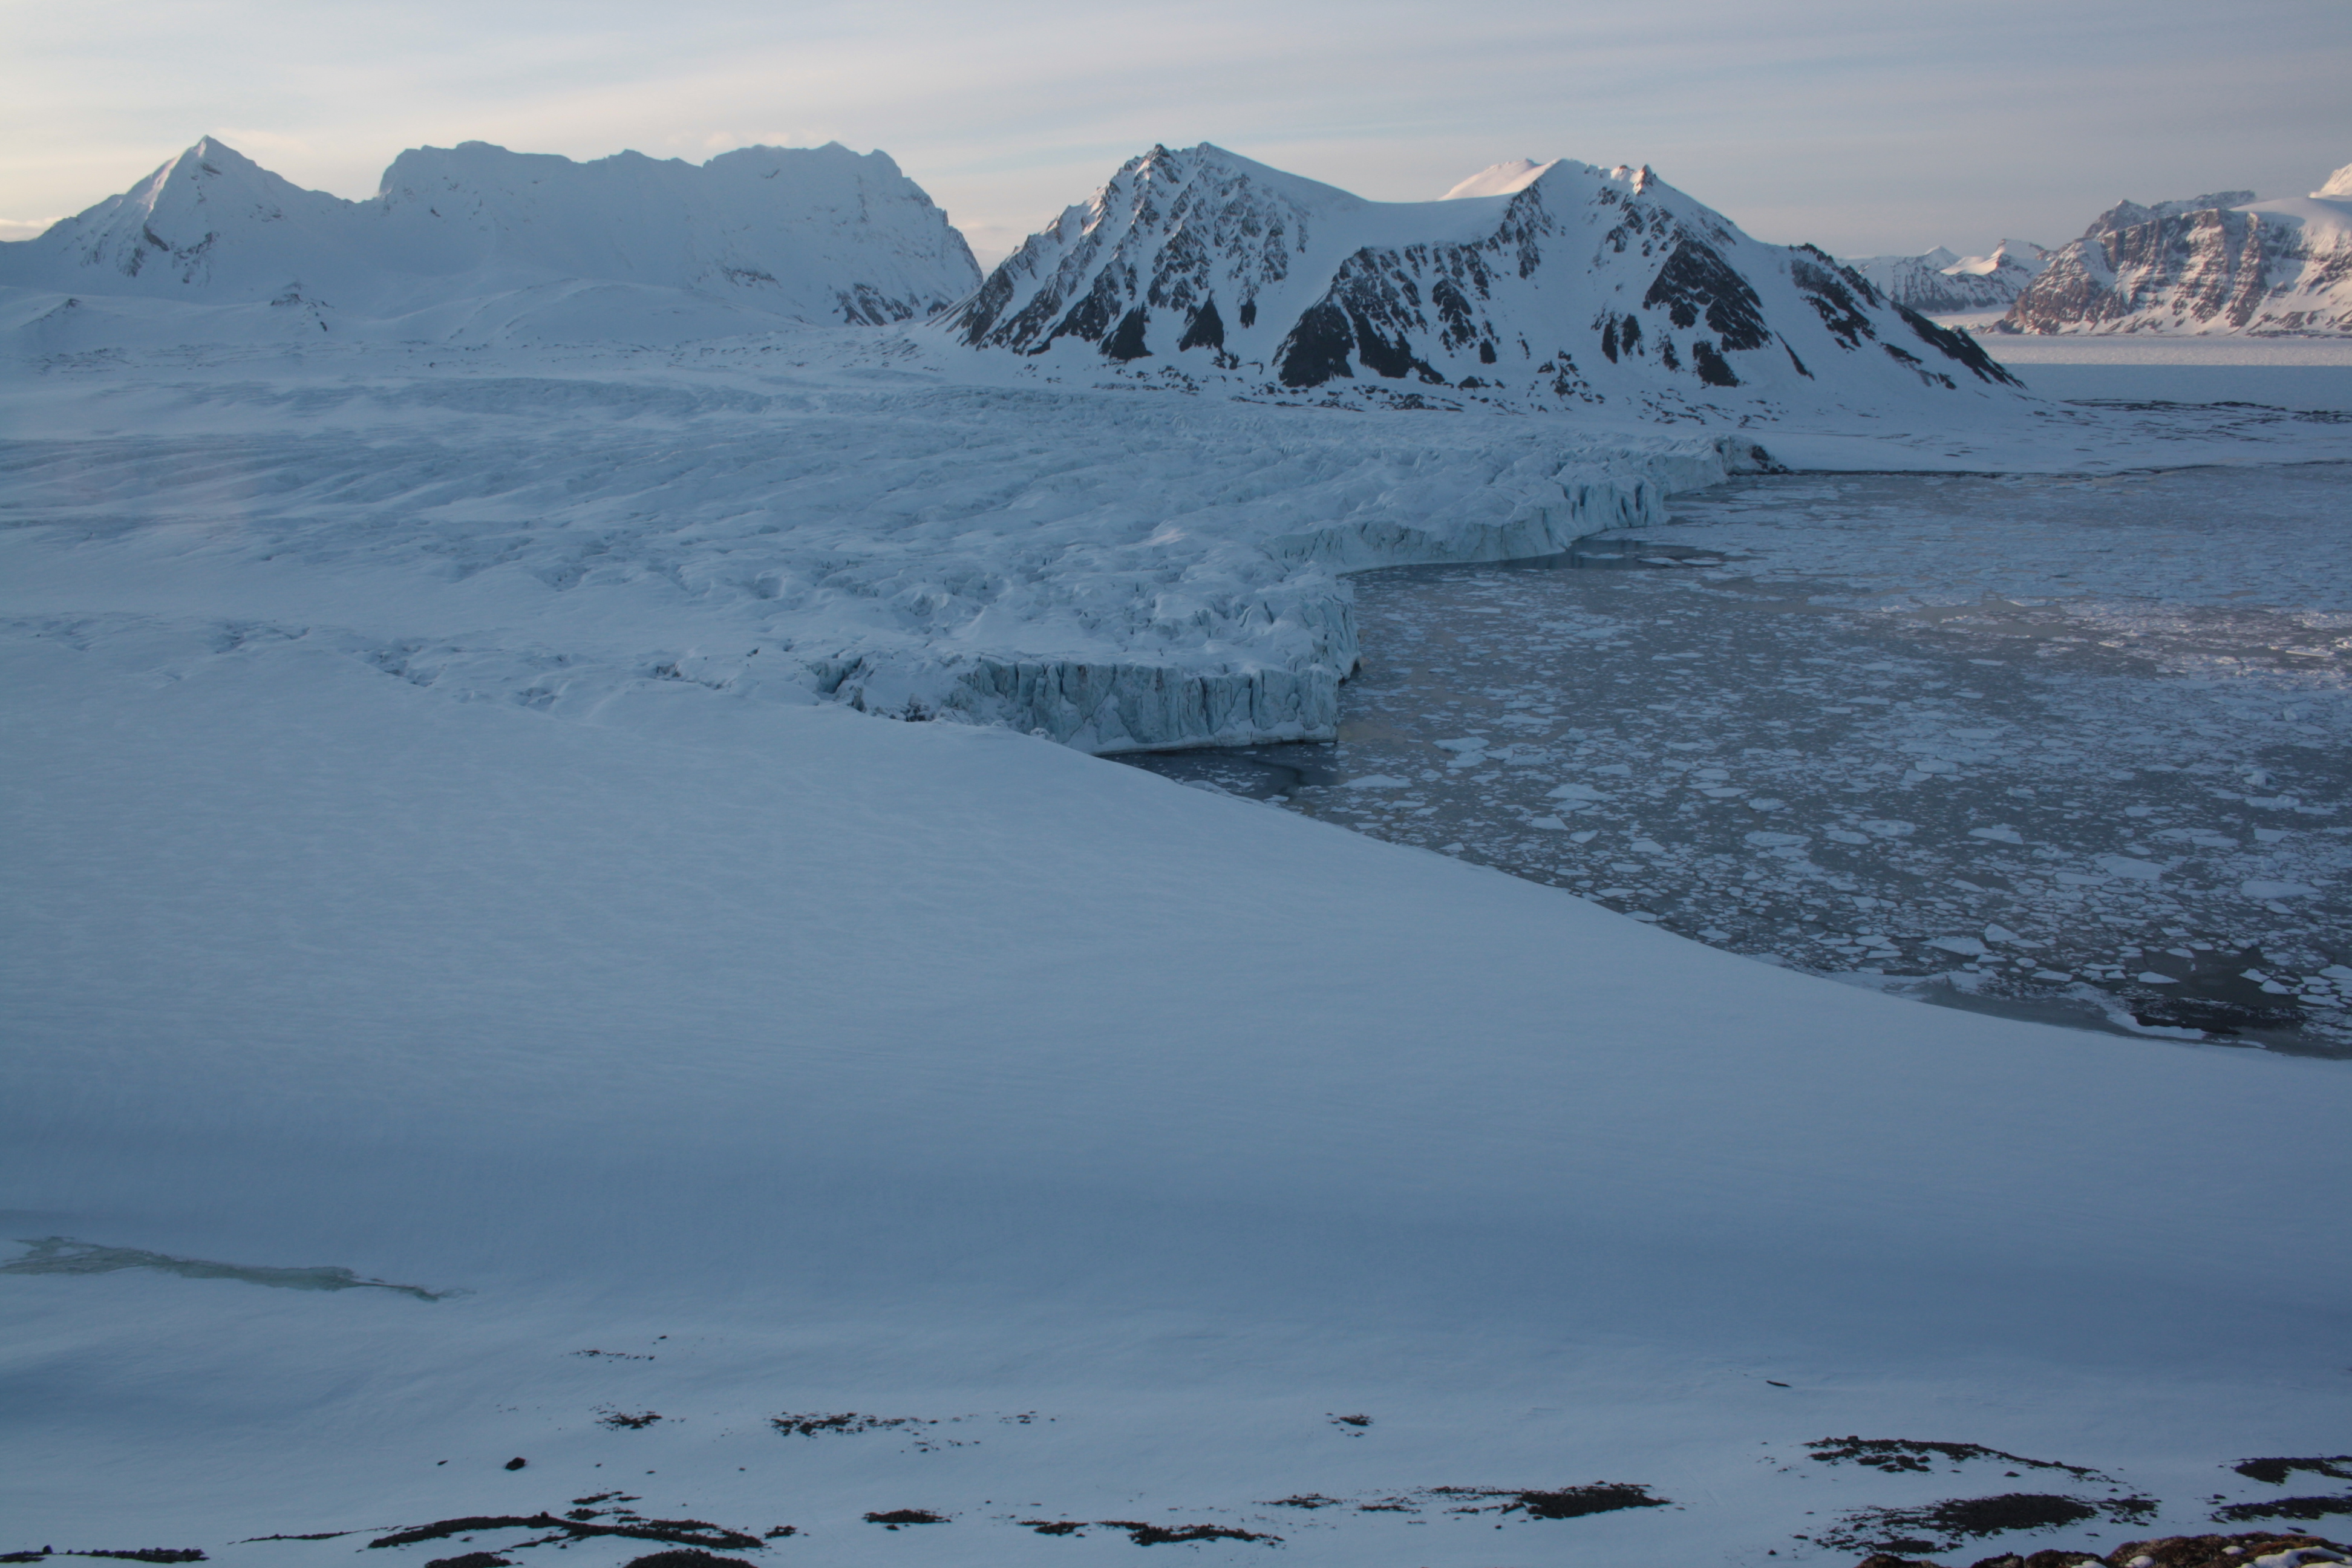
Since 2010, continuous monitoring of the front zone of the Hansa Glacier with the use of Canon Eos 1000D photo cameras has been carried out (timelapse). Pictures in different periods of time were taken by 3 different cameras. Two cameras (106 and 107) were located on the Fugleberget slope and one (601) on the Baranowskiodden. The periods for which data are available and the interval of taking pictures are shown in Appendix 1.
-

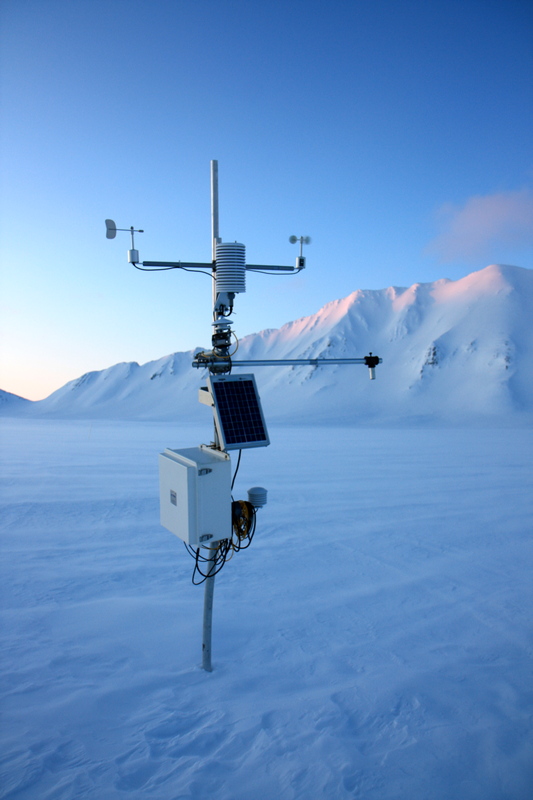
Downwelling longwave flux in air measurements from AWS located on the Werenskioldbreen. The sensors are installed on a mast that is mounted in the glacier ice. During the season, the distance between the glacier's surface and the sensors increases. The station is serviced at least once a year between March and April.
-
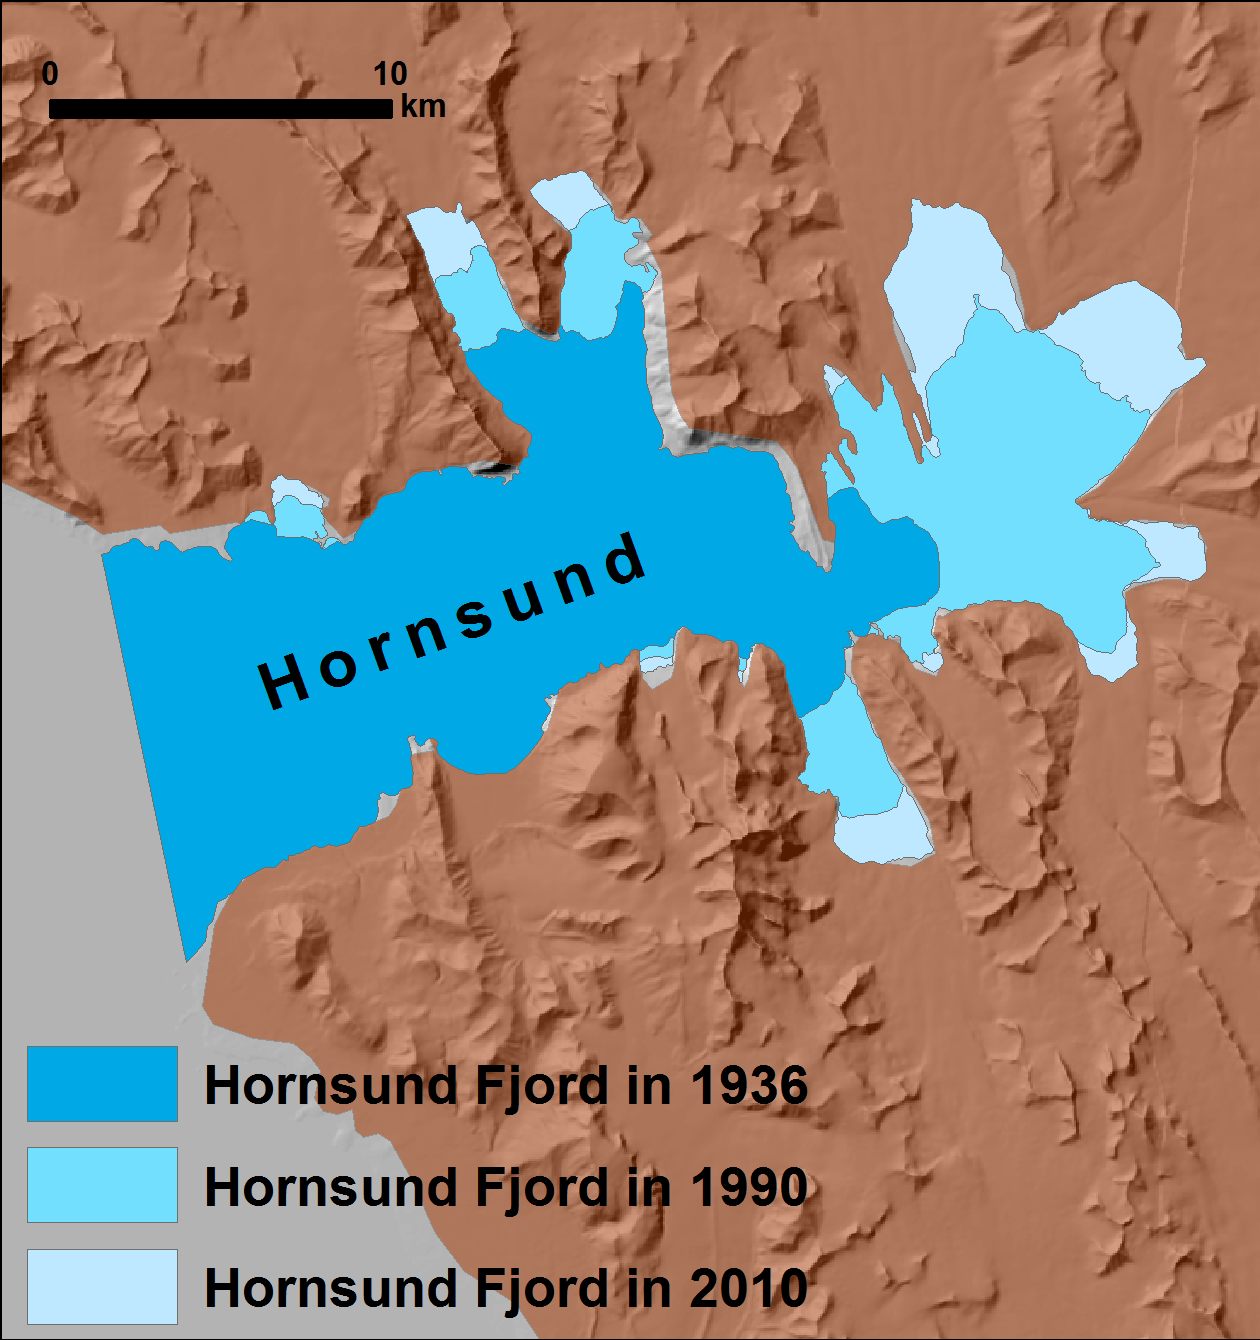
Hornsund area extracted from different archive data. Detailed description of the source data and accuracy data for glaciers from hydrological basin of Hornsund can be found in: Błaszczyk M., Jania J.A., Kolondra L., 2013: Fluctuations of tidewater glaciers in Hornsund Fiord (Southern Svalbard) since the beginning of the 20th century. Polish Polar Research, 34( 4): 327-352. http://journals.pan.pl/dlibra/publication/114504/edition/99557/content
-
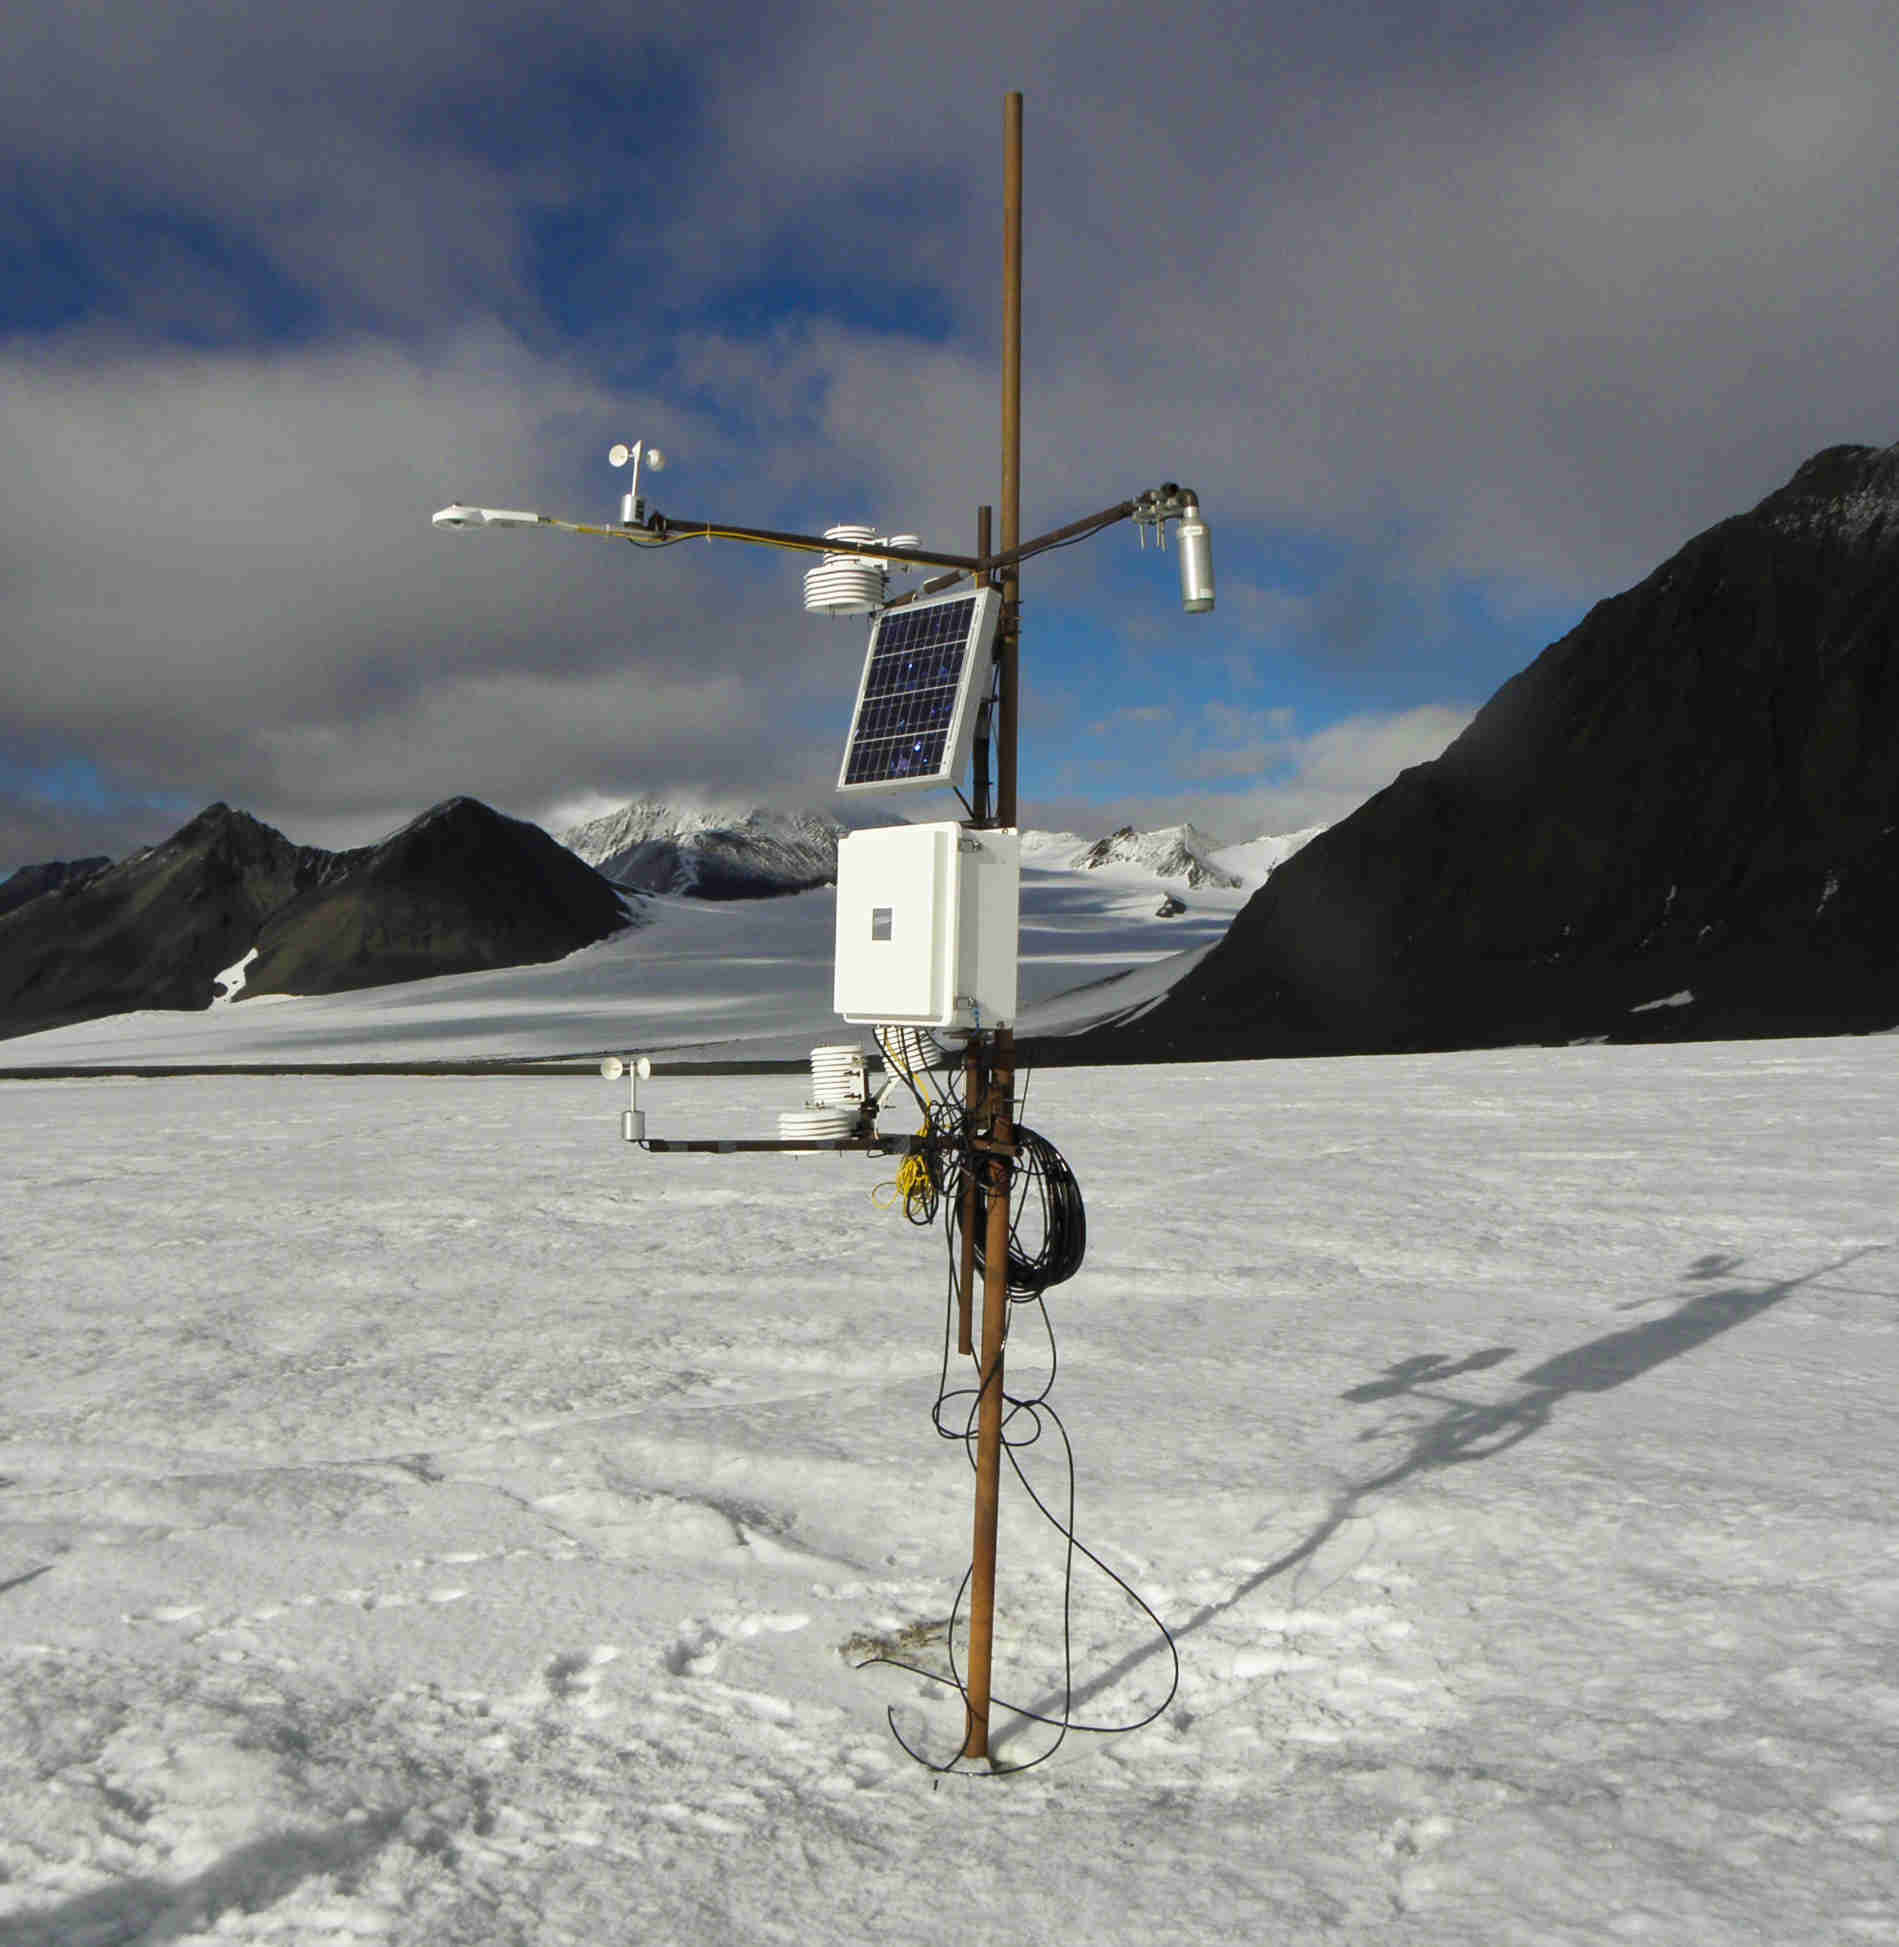
Downwelling shortwave flux in air measurements from AWS located on the Werenskioldbreen. The sensors are installed on a mast that is mounted in the glacier ice. During the season, the distance between the glacier's surface and the sensors increases. The station is serviced at least once a year between March and April.
-

Upwelling longwave flux in air measurements from AWS located on the Werenskioldbreen. The sensors are installed on a mast that is mounted in the glacier ice. During the season, the distance between the glacier's surface and the sensors increases. The station is serviced at least once a year between March and April.
-

Upwelling shortwave flux in air measurements from AWS located on the Werenskioldbreen. The sensors are installed on a mast that is mounted in the glacier ice. During the season, the distance between the glacier's surface and the sensors increases. The station is serviced at least once a year between March and April.
-

Wind speed measurements from AWS located on the Werenskioldbreen. The sensors are installed on a mast that is mounted in the glacier ice. During the season, the distance between the glacier's surface and the sensors increases. The station is serviced at least once a year between March and April.
-
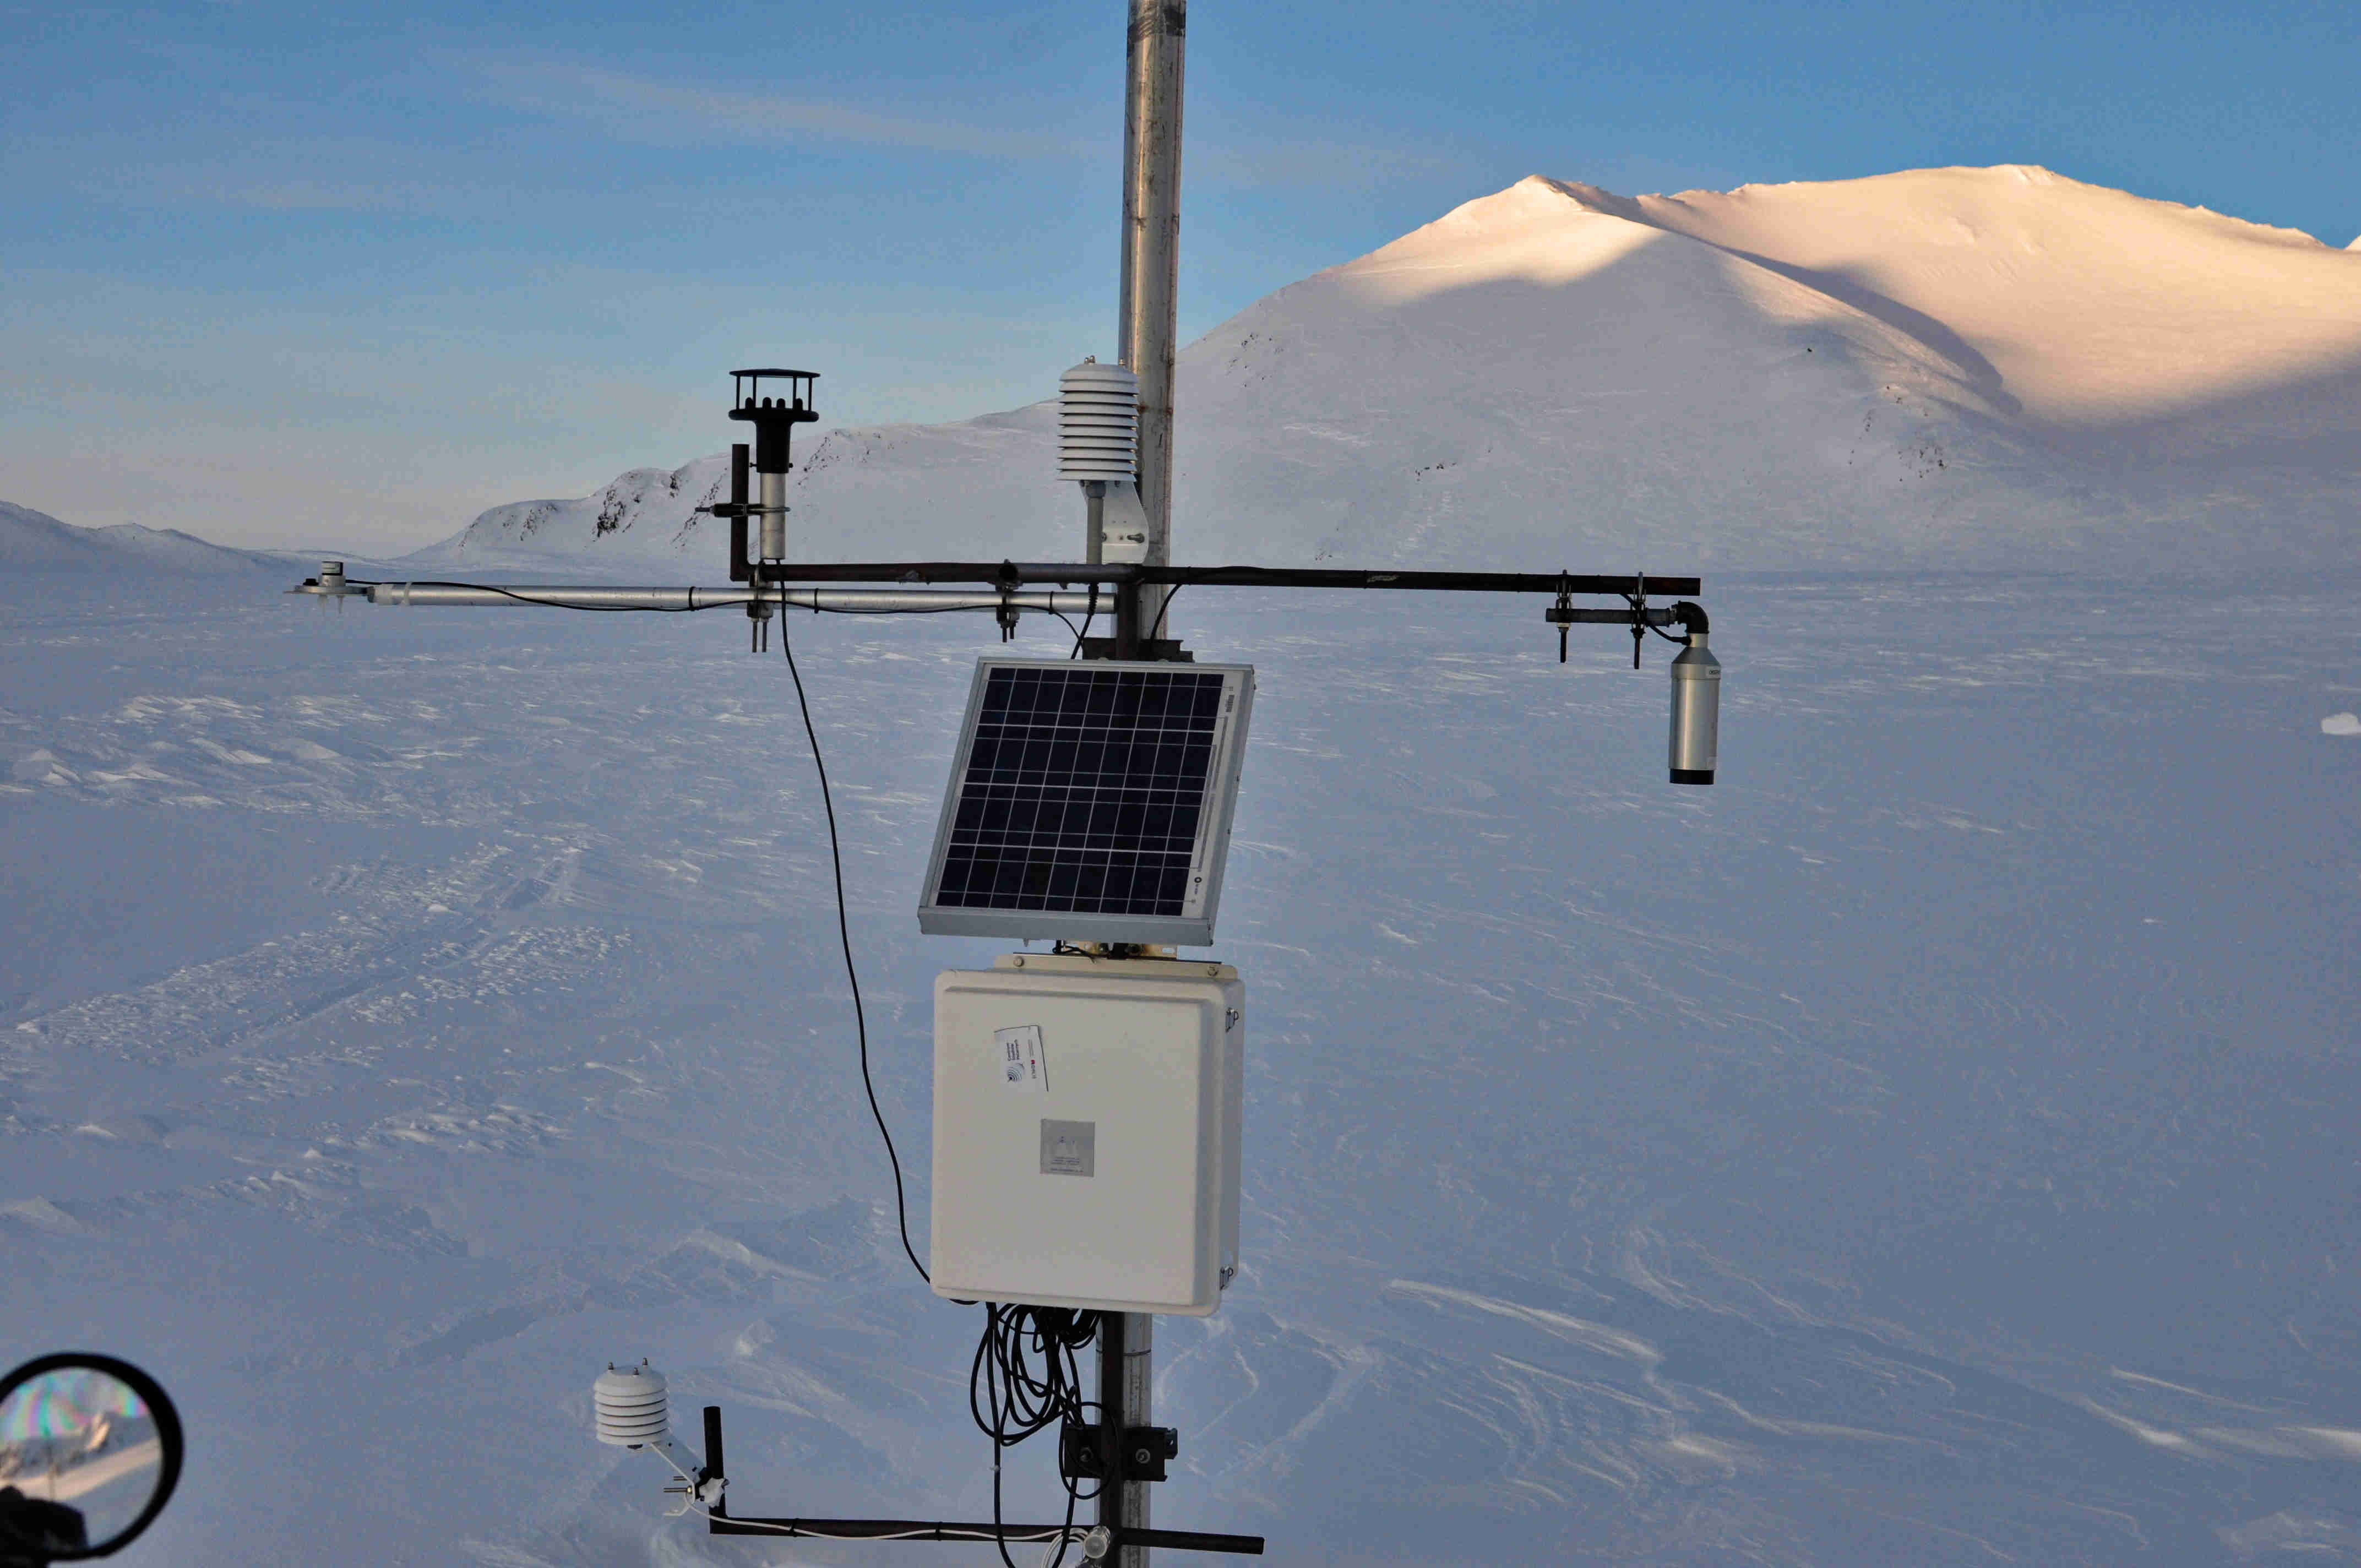
Wind direction measurements from AWS located on the Werenskioldbreen. The sensors are installed on a mast that is mounted in the glacier ice. During the season, the distance between the glacier's surface and the sensors increases. The station is serviced at least once a year between March and April.