 Centre for Polar Studies
University of Silesia
Type of resources
Available actions
Topics
Keywords
Contact for the resource
Provided by
Representation types
Update frequencies
status
-
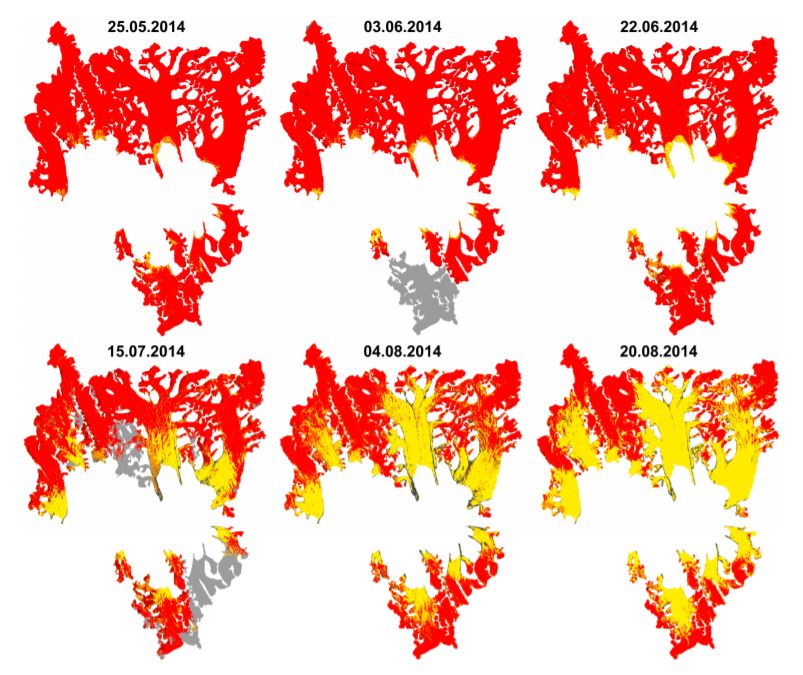
Results of supervised classification of six Landsat 8 images acquired on: 25 May, 3 June, 22 June, 15 July, 4 August and 20 August 2014, covering glaciers in Hornsund fiord. Method of classification: Maximum Likelihood. The results show variability of snow cover areas in melting period of 2014 for glaciers located in Hornsund fiord and larger than 9 km2 (Körberbreen, Samarinbreen, Chomjakovbreen, Mendelejevbreen, Svalisbreen, Hornbreen, Storbreen, Kvalfangarbreen, Mühlbacherbreen, Paierlbreen and Hansbreen). For more information, please check: https://doi.org/10.3390/w9100804 Overview: Results of Maximum Likelihood classification of Landsat 8 images for analysed glaciers. Red - snow cover, yellow - glacier ice, black - debirs, grey - cloud cover.
-
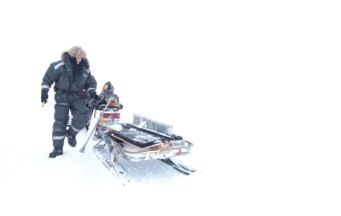
The monitoring of the mass balance of the Werenskioldbreen (Wedel Jarlsberg Land, Spitsbergen, Svalbard) in the years 1999-2002 and 2009-2018. It is calculated on the base of 4 to 9 ablation stakes (depend on year). The mass balance is determined by conducting field surveys on floating calendar dates (floating-date system). Data have also been submitted to the World Glacier Monitoring Sevice (WGMS, https://wgms.ch)
-
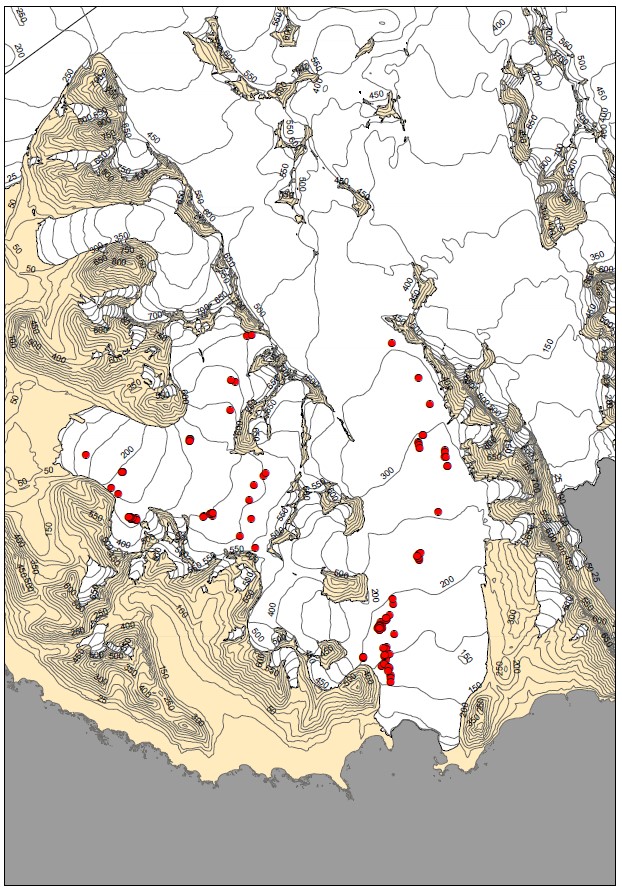
Dataset contains location of glacial shafts (moulins) on two polythermal glaciers: Werenskioldbreen and Hansbreen. Fieldwork has been done with GPS device at the end of ablation season in 2015. Acknowledgements: Research Council of Norway, Arctic Field Grant 2013: Spatial distribution of snow cover and drainage systems on the glaciers on Wedel Jarlsberg Land (RiS ID: 6158); the National Science Centre PRELUDIUM 4: Role of meltwater from snow cover for supplying drainage systems of the Spitsbergen glaciers (2012/07/N/ST10/03784)
-
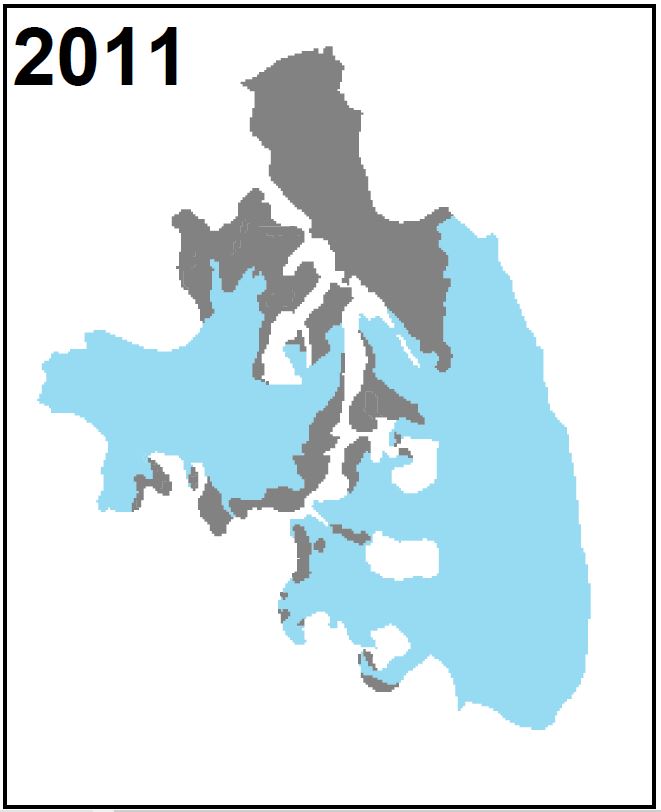
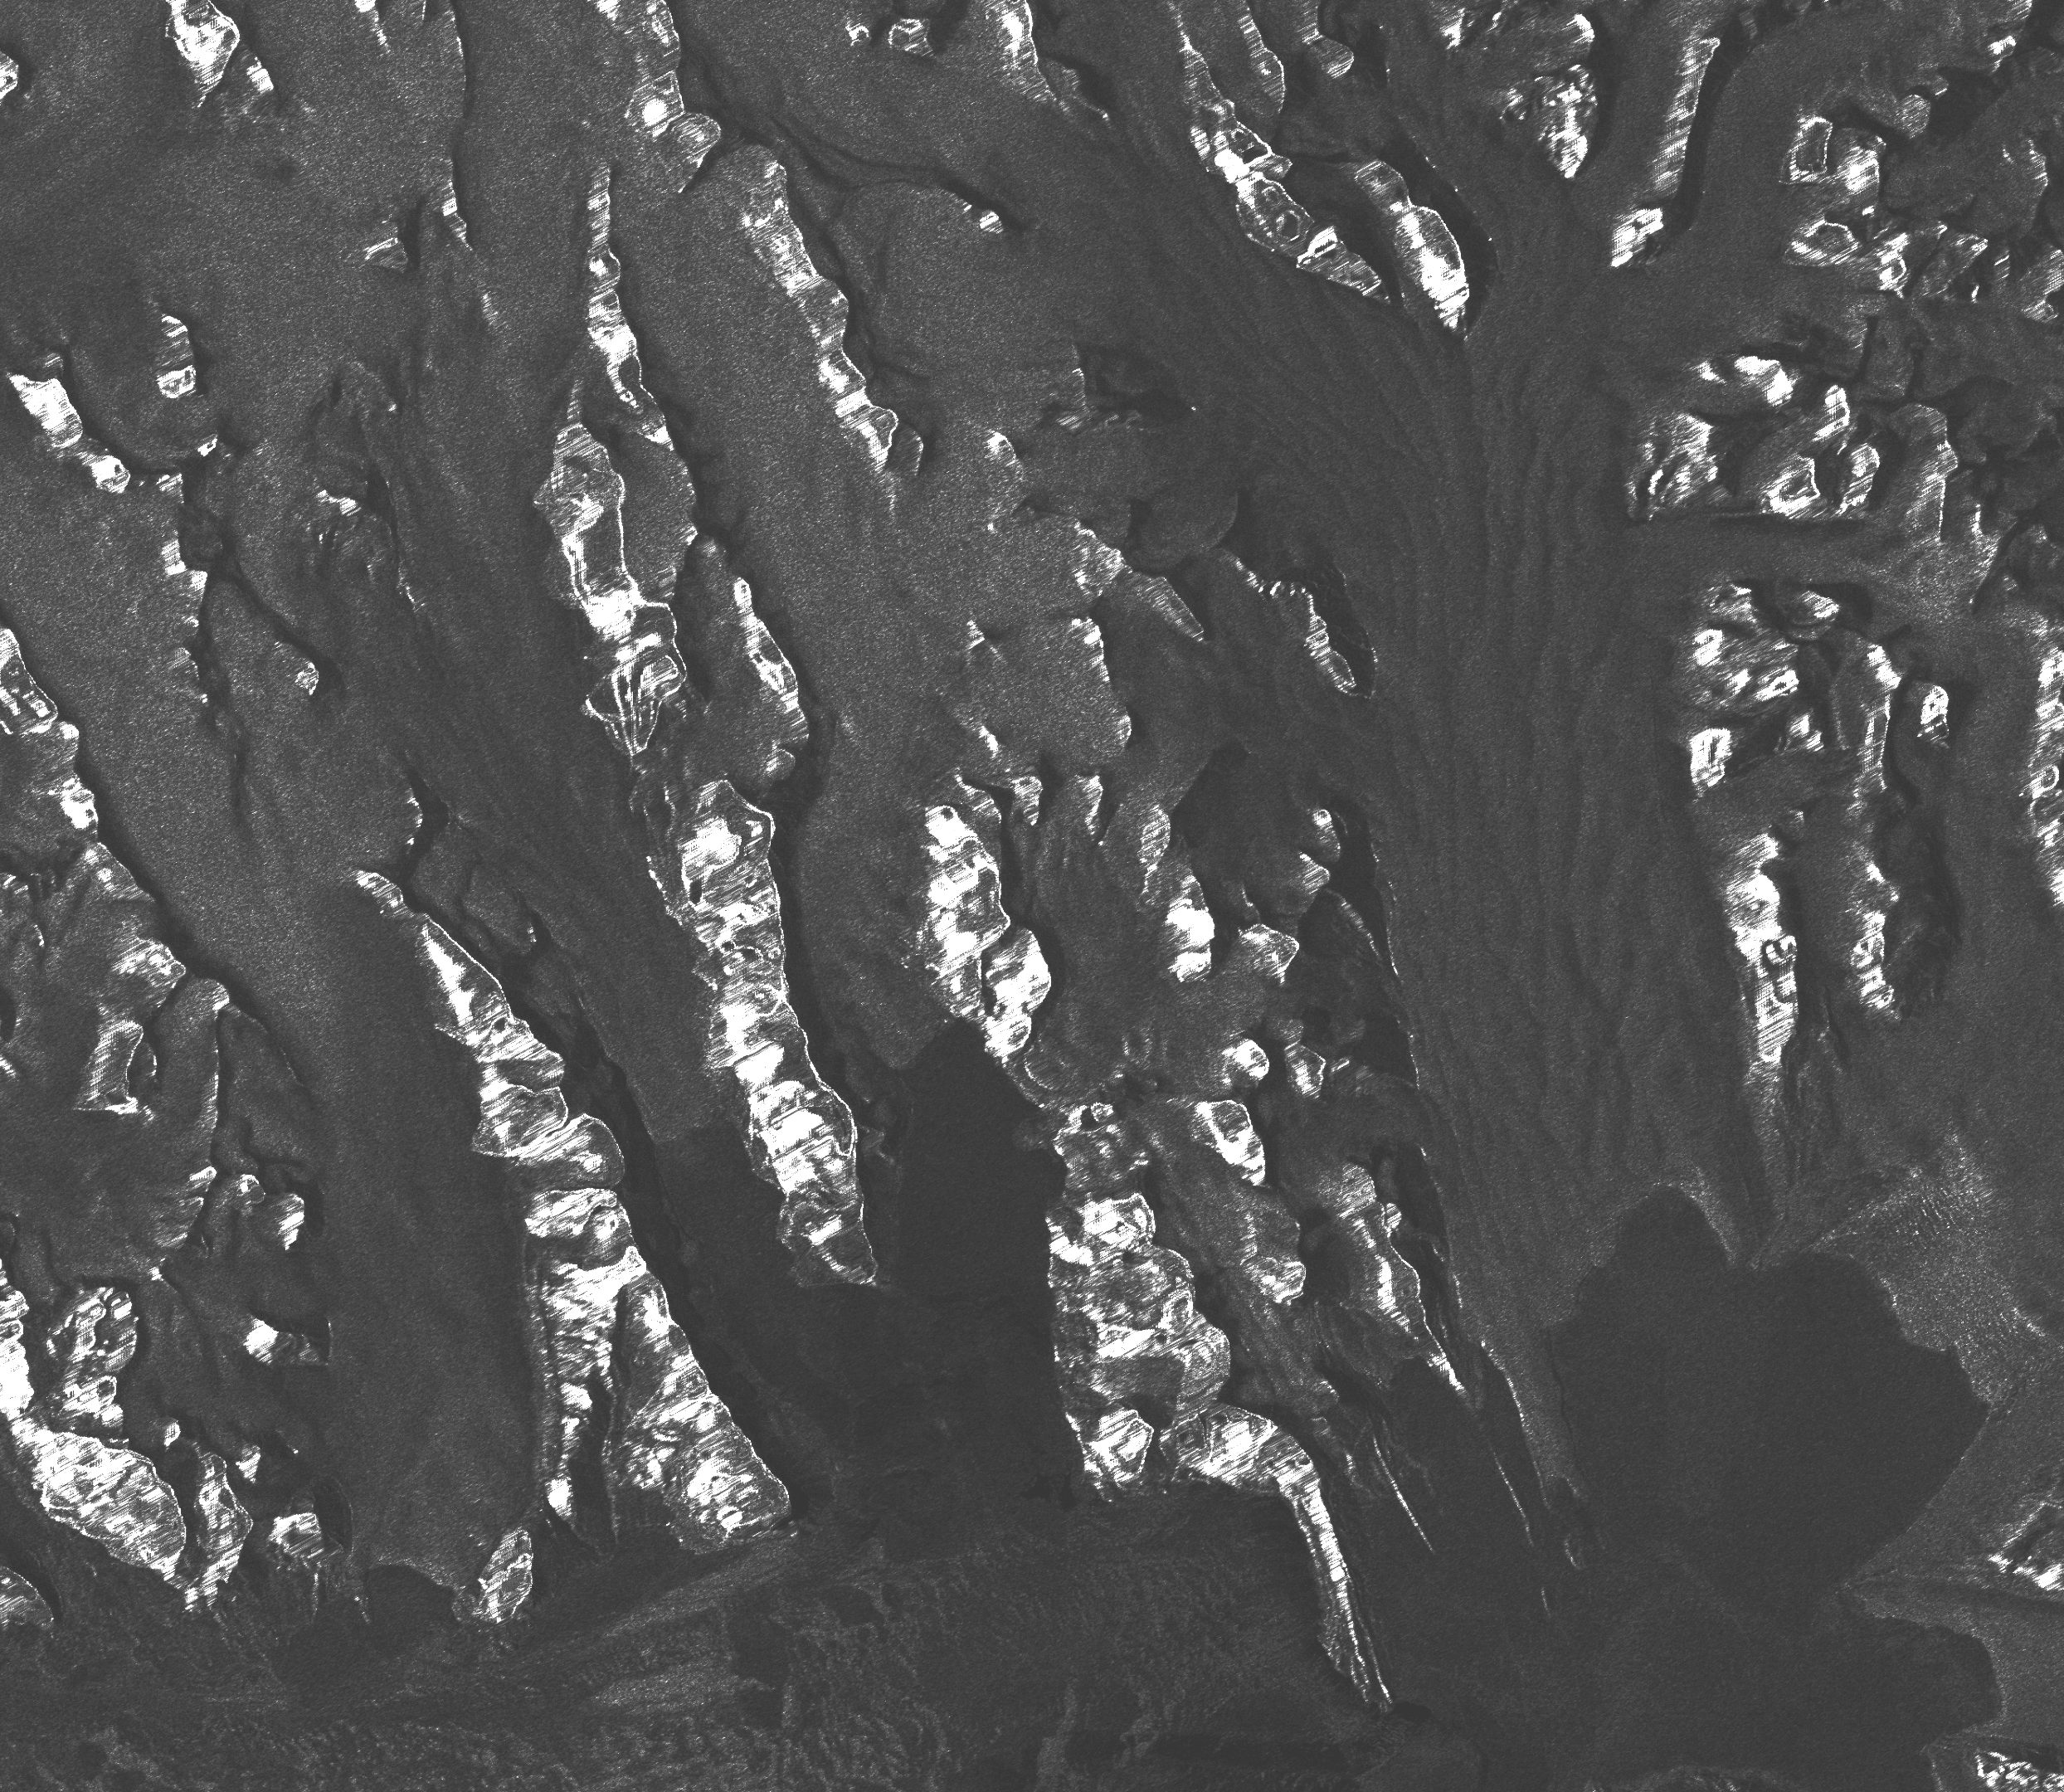
Firn extents of Hansbreen and Werenskoildbreen delivered from unsupervised classifications of single, dual and fully-polarimetric SAR data (ALOS-2 PALSAR, RADARSAT-2, Sentinel-1, ERS-2 SAR) between 2011 and 2017. Methods of classification: unsupervised ISO classification, H-a Wishart Classification. Results validated with terrestrial measurements (shallow ice cores drilling, Ground Penetrating Radar measurements). Research supported by the European Space Agency, Third Party Missions grant and Svalbard Science Forum, Arctic Field Grant 2018. For more details, please e-mail to this adress: bbarzycka@us.edu.pl.
-
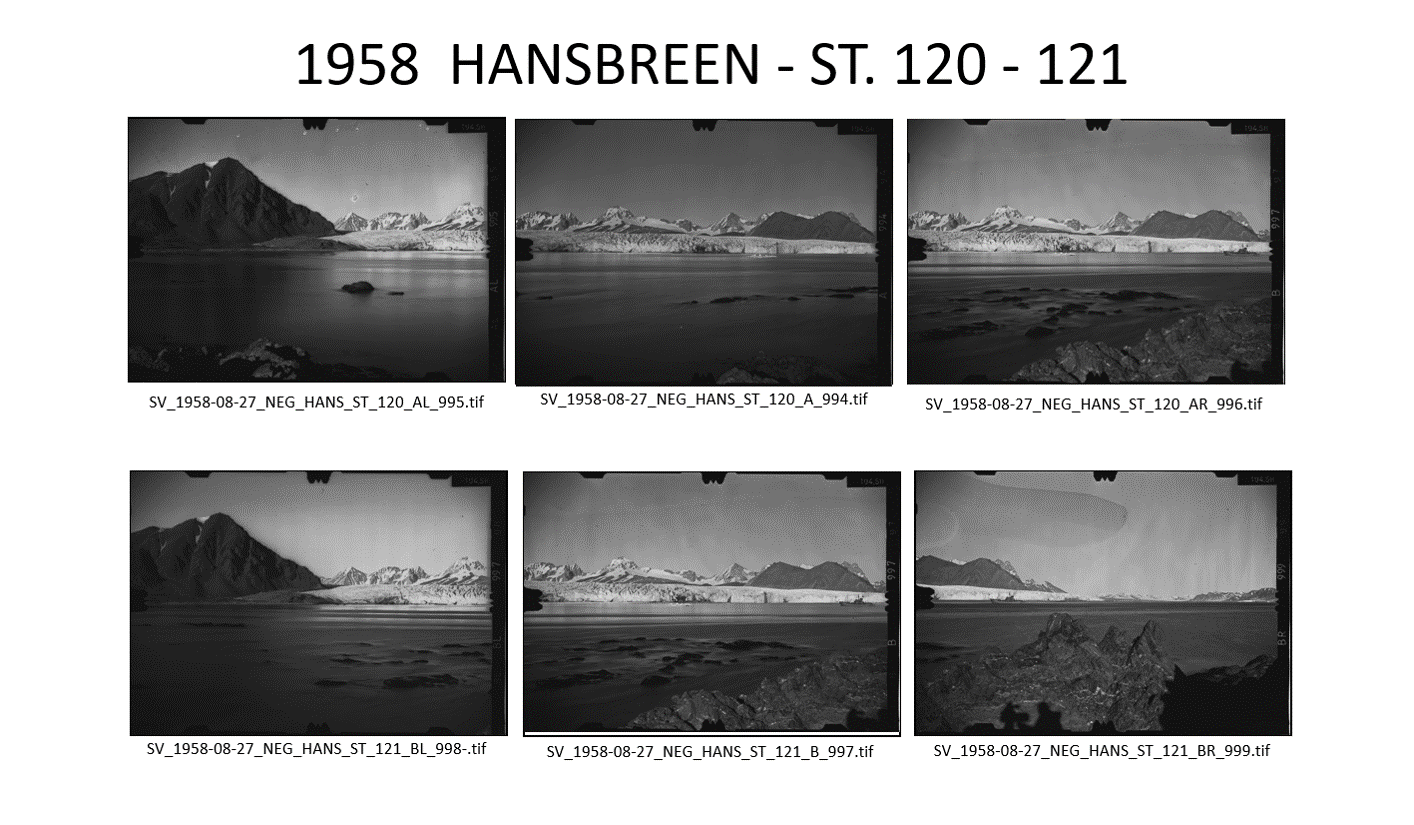
The base contain: 1. List (*xls) of terrophotogrammetric photographs taken by Poles na Spitsbergen from 1934 till 2016: 2. Skaning above photographs with resolution of 2400 dpi, file format *.tif and *.jpg (400 dpi). All photographs were taken by means of instrument type Phototheodolite Zeiss 19/1318 on glass plates. Authors of photographs: Antoni Rogala-Zawadzki, Cezary Lipert, Stanisław Rudowski, Leszek Kolondra, Jacek Jania, Jerzy Wach, Krzysztof Migała, Janusz Karkoszka, Małgorzata Błaszczyk and other unknown members of Polish Expeditions organized by Institute of Geophysic Polish Academy of Science in Station HORNSUND. Fot better identification of all photographs was prepared presentations (in *.pptx and *.pdf formats), where photographs there are arranged in classic form used for terrophotogrammetric stereoscopic photographs: A, AL, AR, B, BL, BR (the meaning of a letter: A - right photogrammetric station and photograph taken in normal case [90°]; B - left photogrammetric station and photograph taken in normal case [90°]; AL - photograph taken from right station in left direction; AR - photograph taken from right station in right direction; BL - photograph taken from left station in left direction; BR - photograph taken from left station in right direction). Other photographs (e.g. panoramic) has additional informations. Boths kind of presentation are prepared in chronological and tematical (for objects) order.
-
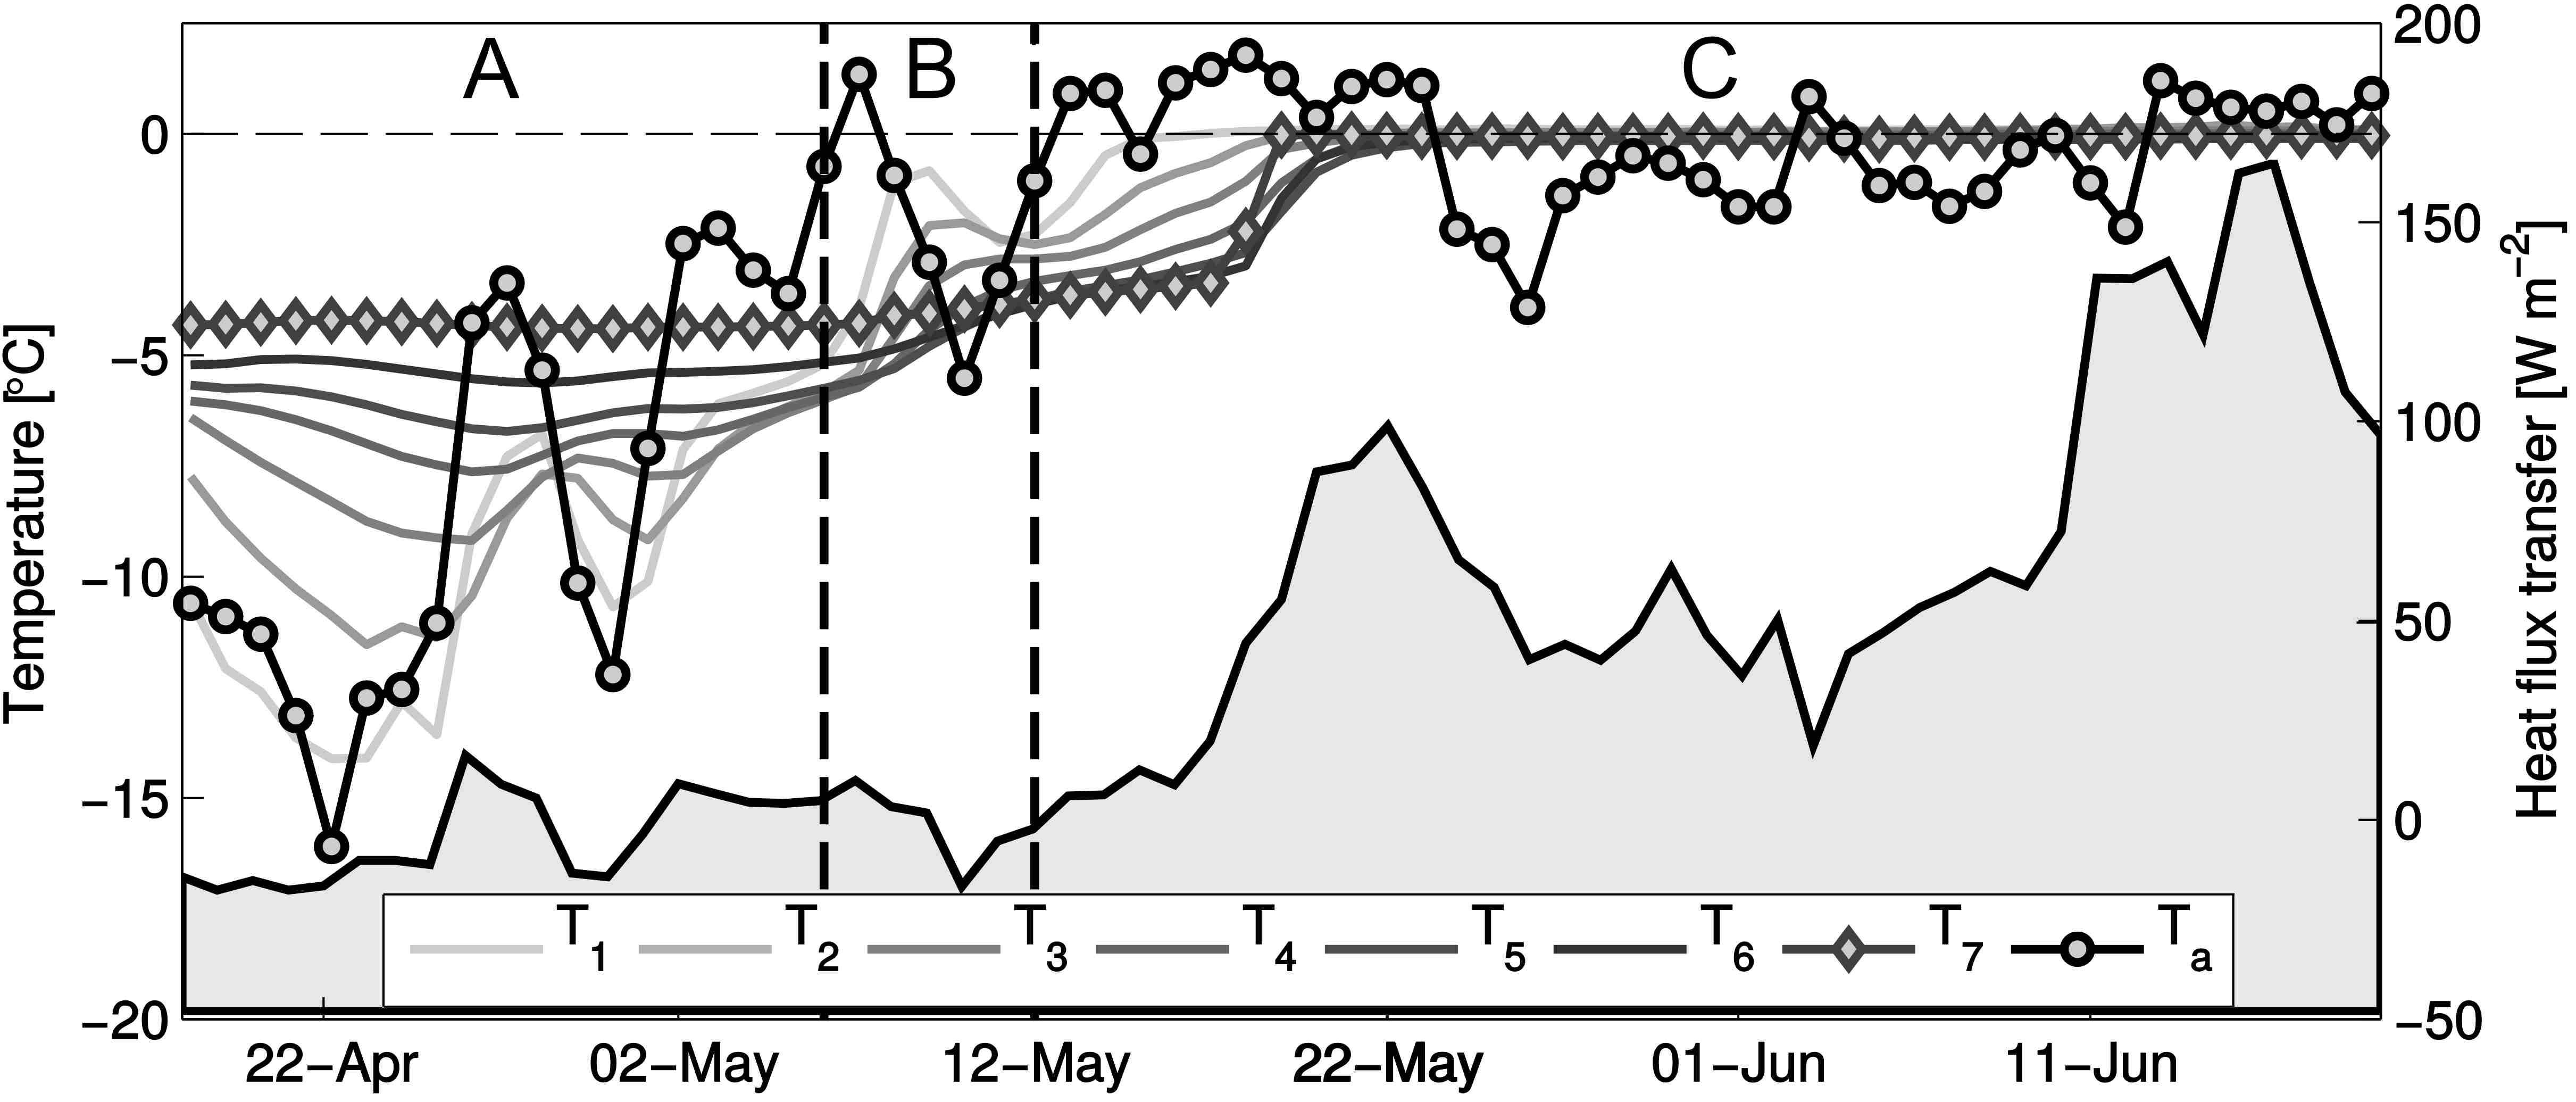
Dataset contains evolution of the snow temperature within seasonal snowpack on Hansbreen. Fieldwork has been performed with several thermistors located at different levels (from snow surface to the bottom, on glacier ice) from April to July 2010 (during period of early and intensive surface melting). Study has been repeated in 2015, at the same location. Acknowledgements: Research Council of Norway, Arctic Field Grant 2013: Spatial distribution of snow cover and drainage systems on the glaciers on Wedel Jarlsberg Land (RiS ID: 6158); the National Science Centre PRELUDIUM 4: Role of meltwater from snow cover for supplying drainage systems of the Spitsbergen glaciers (2012/07/N/ST10/03784) References: Laska M., Luks B., Budzik T., 2016. Influence of snowpack internal structure on snow metamorphism and melting intensity on Hansbreen, Svalbard. Polish Polar Research, 37(2): 193–218. doi:10.1515/popore-2016-0012
-
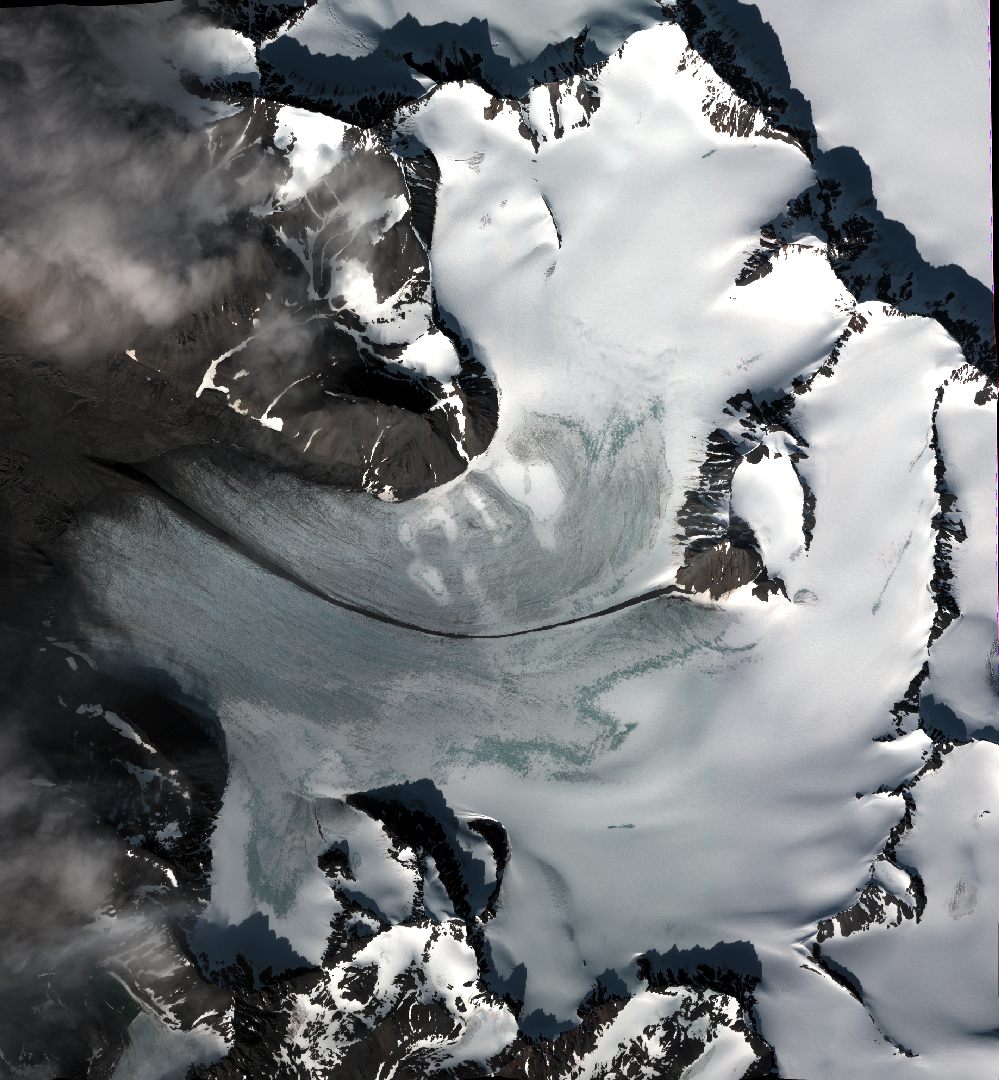
High resolution orthophoto images from Geoeye, WorldView-2 and Pléaides processed in OrthoEngine module of PCI Geomatica. Data format: grid, UTM 33X / EGM 2008. Spatial resolution: 0.5 m (panchromatic and pansharpened) and 2 m (multispectral).
-
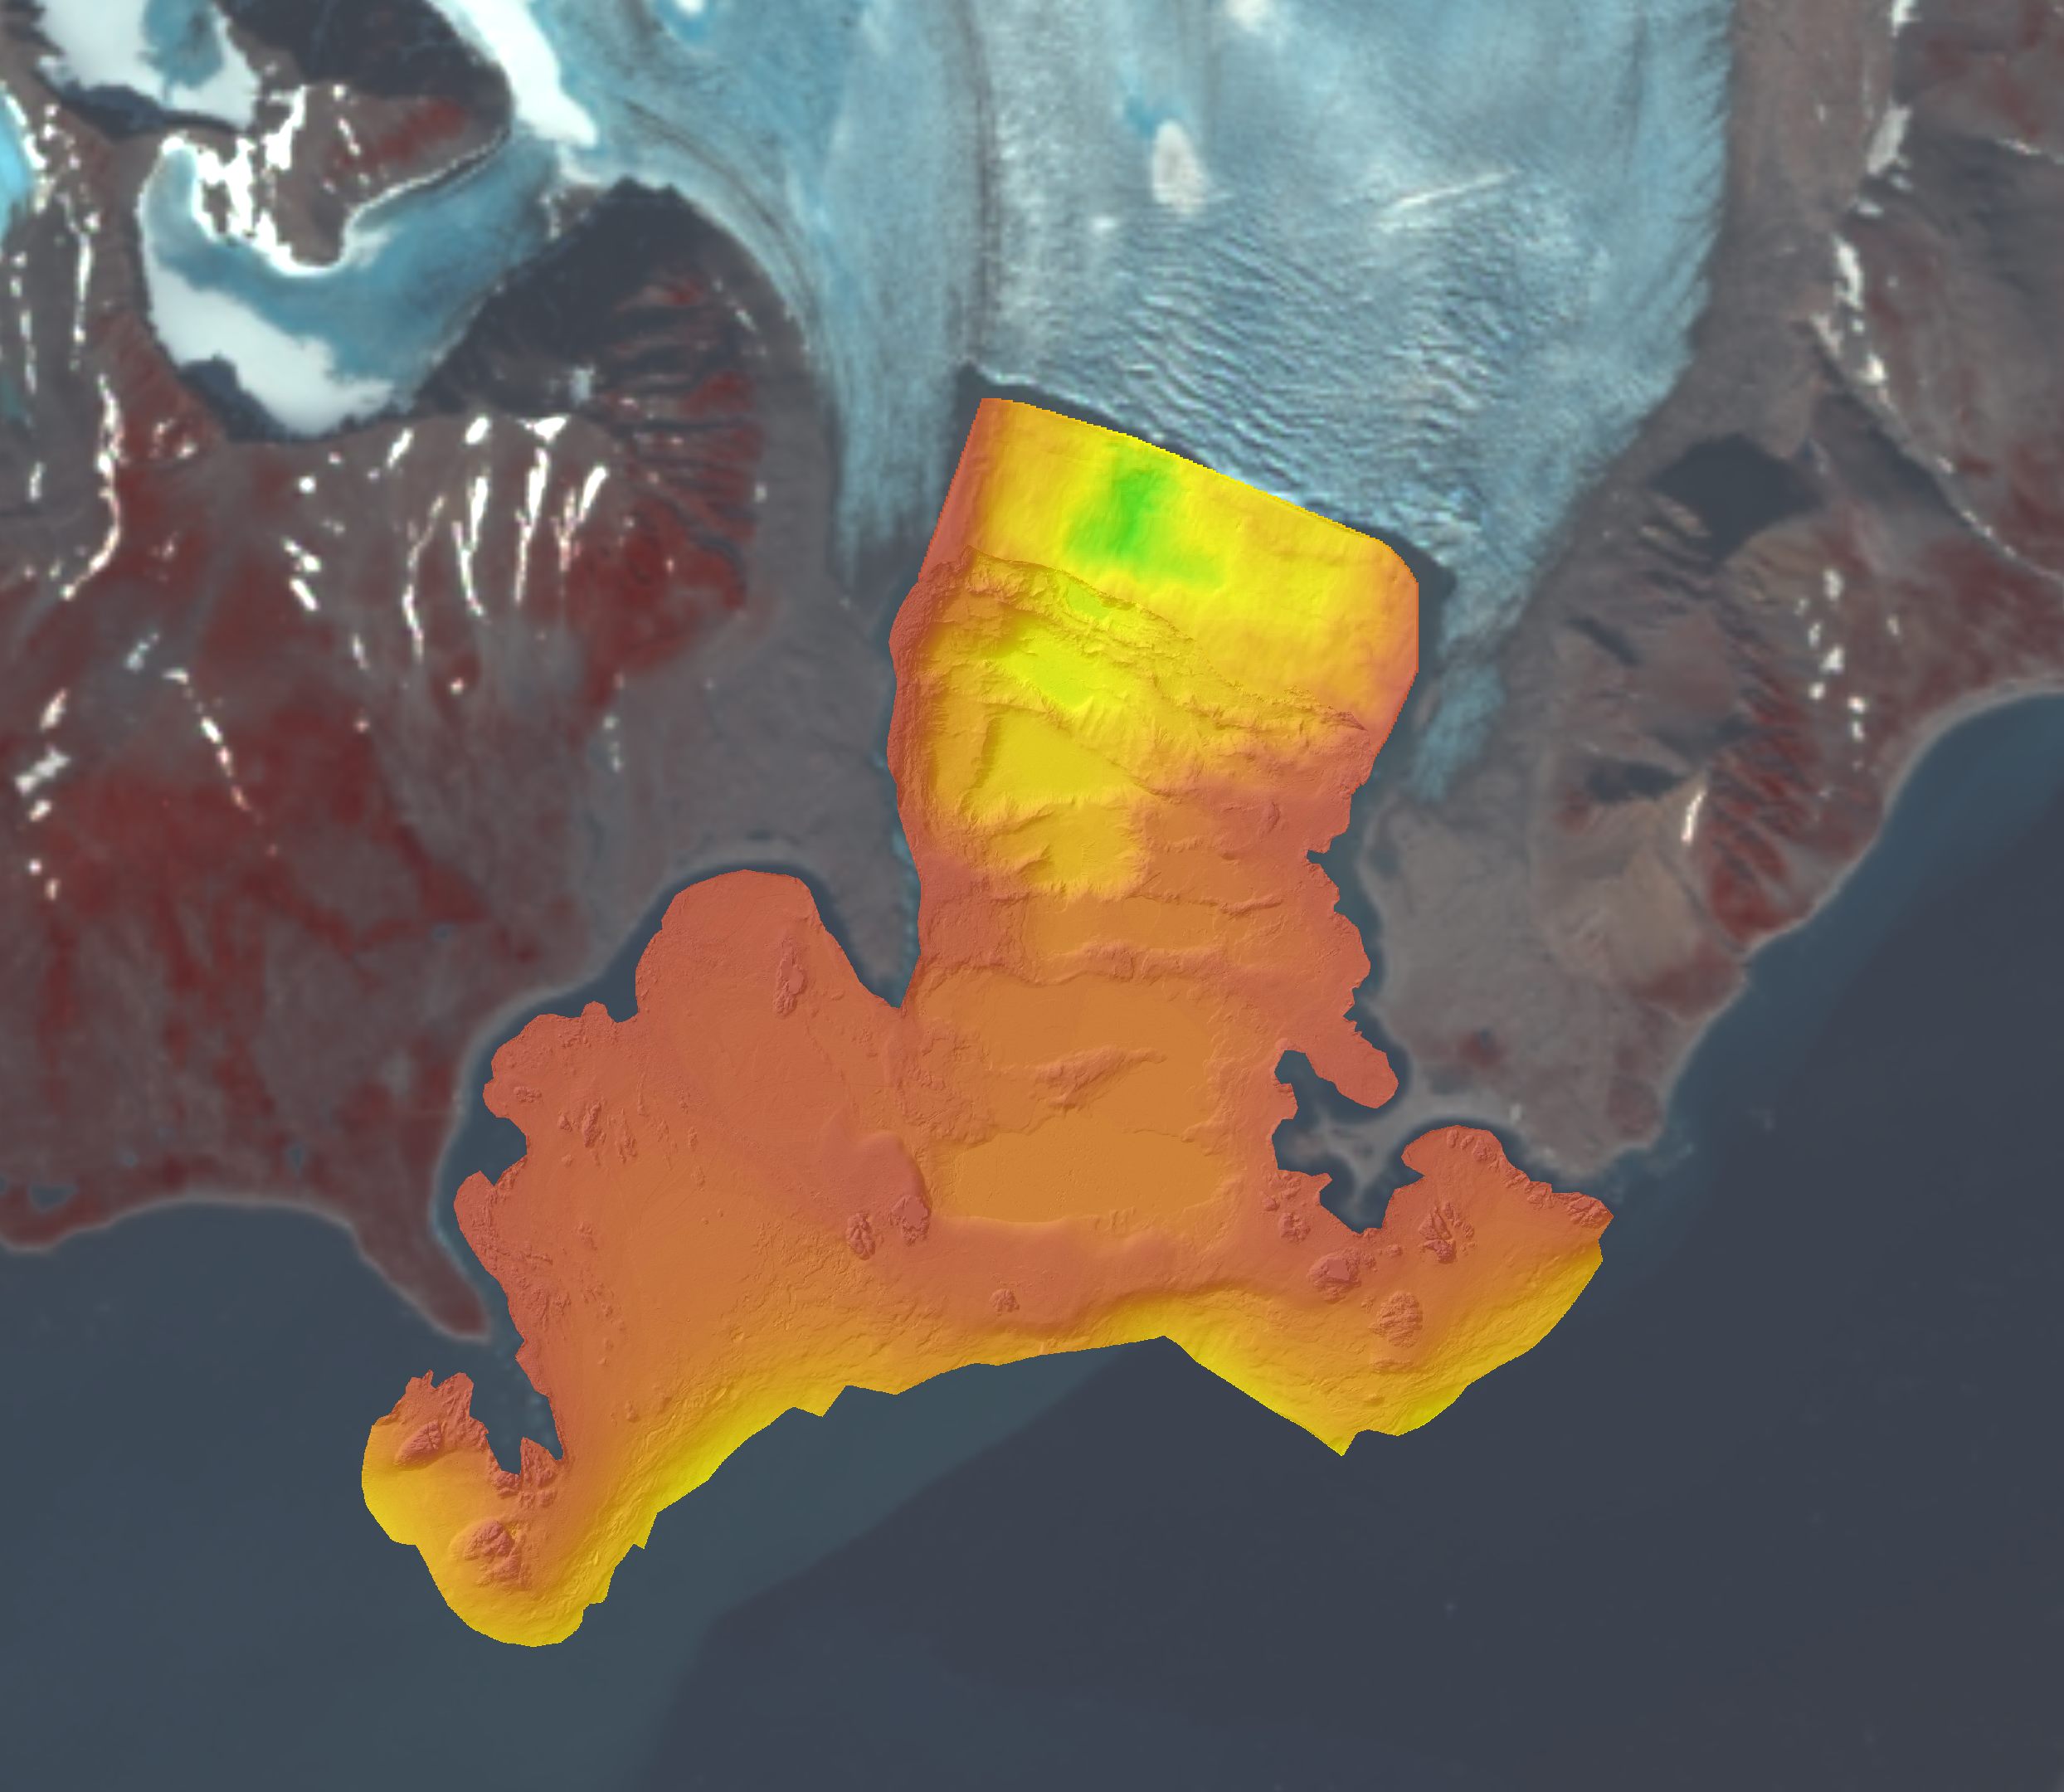
Bathymetry at the front of tidewater glaciers derived from different sources. Bathymetry data in Hansbukta and Burgerbukta have been collected by the Norwegian Hydrographic Service using a multi-beam survey during 2007–2008. Later measurements in Hansbukta were collected with single beam profiling at the Hansbreen front in 2015. Data format: grid (6m), UTM 33X. Single echo-sounding data collected during summer 2011, by the University of Silesia.
-
Radar satellite (SAR) images for Hornsund: ERS-1, ERS-2, ENVISAT, ALOS Palsar, TerraSAR-X, TandemX-1, acquired between 1992 and 2014. 210 archival SAR data were provided at the SLC level, so that both radiometric and geometric corrections were applied using the same methods, and with the same digital elevation model (2008 DEM SPOT developed by the IPY-SPIRIT Project; Korona et al., 2009). The SAR data were processed in BEAM (http://www.brockmann-consult.de/cms/web/beam).
-
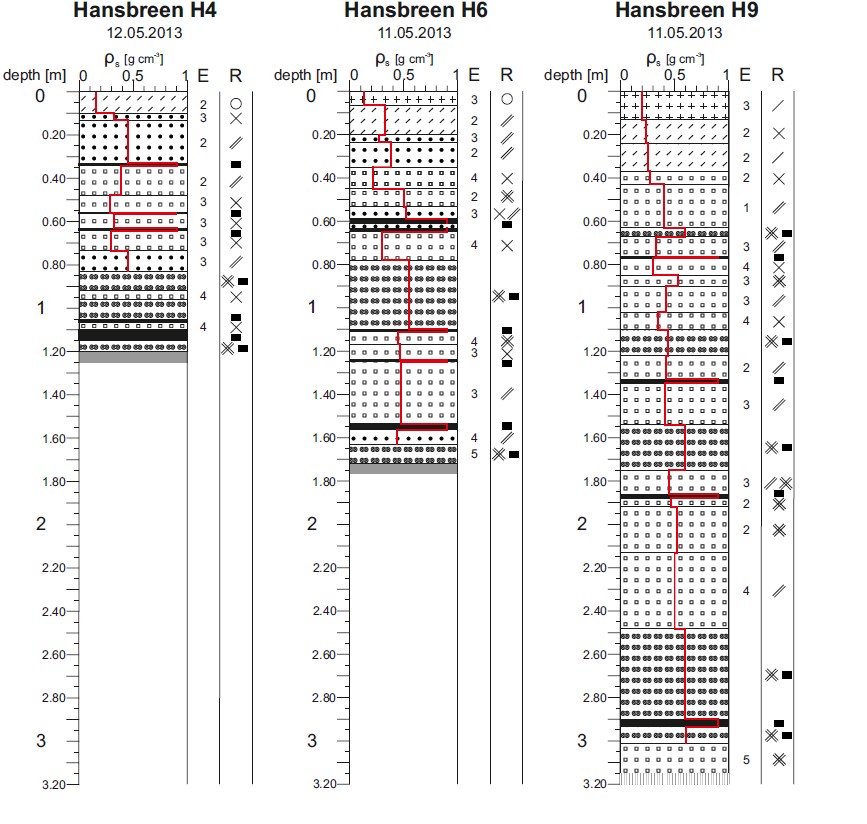
Dataset contains detailed measurements of physical features of seasonal snow cover, according to International Classification of Seasonal Snow on the Ground (Fierz et al. 2009). Fieldwork has been done during peak of accumulation on several glaciers in the region of Hornsund, Svalbard: Amundsenisen (2013) Hansbreen (three sites; 2010, 2012, 2013, 2014, 2015, 2017, 2018) Werenskioldbreen (two sites; 2013, 2015) Nannbreen (2013) Ariebreen (2014) Acknowledgements: Research Council of Norway, Arctic Field Grant 2013: Spatial distribution of snow cover and drainage systems on the glaciers on Wedel Jarlsberg Land (RiS ID: 6158); the National Science Centre PRELUDIUM 4: Role of meltwater from snow cover for supplying drainage systems of the Spitsbergen glaciers (2012/07/N/ST10/03784) References: Laska M., Luks B., Budzik T., 2016. Influence of snowpack internal structure on snow metamorphism and melting intensity on Hansbreen, Svalbard. Polish Polar Research, 37(2): 193–218. doi:10.1515/popore-2016-0012 Laska M., Grabiec M., Ignatiuk D., Budzik T., 2017. Snow deposition patterns on southern Spitsbergen glaciers, Svalbard, in relation to recent meteorological conditions and local topography. Geografiska Annaler, Series A: Physical Geography, 99(3): 262–287 doi:10.1080/04353676.2017.1327321 Laska M., Barzycka B., Luks B., 2017. Melting Characteristics of Snow Cover on Tidewater Glaciers in Hornsund Fjord, Svalbard. Water, 9(10), 804. doi:10.3390/w9100804